


Market Review Thursday:
1H Chart of GBP/USD Pair
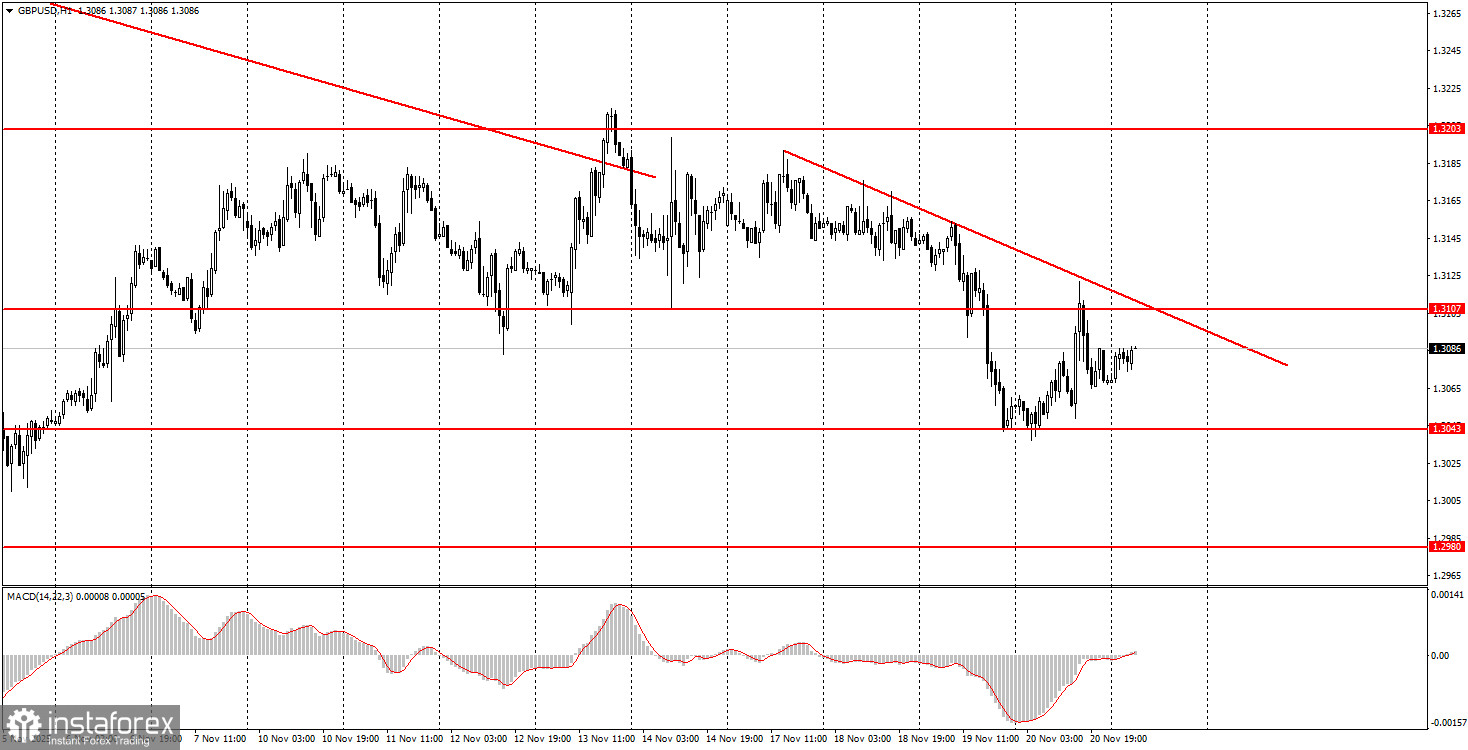
The GBP/USD pair traded higher on Thursday, but with extremely low volatility. Despite the release of two crucial reports on the U.S. labor market and unemployment, neither report sparked volatility at the time. The British pound rose from the level of 1.3043 to 1.3107, but now a new, yet another descending trend line has been formed, which must be overcome in order to expect further growth of the British currency. We have already mentioned that reports on NonFarm Payrolls and unemployment are important, but the data from yesterday does not allow for any conclusions about the last Federal Reserve meeting of the year or the possible decision on rates. Thus, they are essentially meaningless. The pound is again at a local "bottom" and will again try to "get up off its knees."
5M Chart of GBP/USD Pair

On the 5-minute timeframe on Thursday, oddly enough, several signals were generated that could be traded. The first signal was formed early in the morning when the price bounced twice from the level of 1.3043, which we mentioned. Subsequently (not without the help of American data), the pair showed growth and worked through the area of 1.3096-1.3107. At this moment, long positions could be closed with a profit. Whether to trade the sell signal in the area of 1.3096-1.3107 is an open question, but execution would not have been loss-making in any case.
How to Trade on Friday:
On the hourly timeframe, the GBP/USD pair is again forming a new downward trend. As we can see, lately, even from a technical perspective, the pair's movements have hardly been completely logical. As we have already said, there are no global reasons for the prolonged rise in the dollar, so in the medium term, we expect only upside movement. However, the correction/flat on the daily timeframe is not over, and the local macroeconomic backdrop continues to negatively impact the British pound.
On Friday, novice traders can expect new trading signals to form in the 1.3096-1.3107 range. A price bounce from this area will allow for opening short positions with a target of 1.3043, while a consolidation above it will allow for long positions with a target of 1.3203.
On the 5-minute timeframe, levels to consider now are 1.2913, 1.2980-1.2993, 1.3043, 1.3096-1.3107, 1.3203-1.3211, 1.3259, 1.3329-1.3331, 1.3413-1.3421, 1.3466-1.3475, 1.3529-1.3543, and 1.3574-1.3590. On Friday, business activity indices for the services and manufacturing sectors for November are scheduled for release in the UK and the U.S., and in the absence of more important data, these reports may provoke a slight market reaction. A slight reaction is expected, as market volatility remains generally weak. Additionally, a retail sales report will be released in the UK, and in the U.S., the University of Michigan consumer sentiment index will be published.
Key Principles of My Trading System:
- The strength of the signal is considered based on the time taken to form the signal (bounce or breach of a level). The less time taken, the stronger the signal.
- If two or more trades have been opened around a certain level based on false signals, all subsequent signals from that level should be ignored.
- In a flat market, any pair can create numerous false signals or may not form them at all. In any case, it's best to stop trading at the first signs of a flat.
- Trading deals are opened during the period between the start of the European session and the middle of the American session, after which all deals should be closed manually.
- On the hourly timeframe, it is preferable to trade based on signals from the MACD indicator only when there is good volatility and a trend that is confirmed by a trend line or trend channel.
- If two levels are too close to each other (between 5 and 20 pips), they should be treated as an area of support or resistance.
- After a 20-pip move in the right direction, a Stop Loss should be set to breakeven.
What the Charts Show:
- Support and resistance price levels are targets for opening buy or sell positions. Take Profit levels can be placed around them.
- Red lines indicate trend channels or trend lines, reflecting the current trend and indicating the preferred trading direction.
- The MACD indicator (14,22,3) — histogram and signal line — is a supplementary indicator that can also be used as a source of signals.
Important announcements and reports (always available in the news calendar) can significantly impact the movement of the currency pair. Therefore, during their release, it is recommended to trade with maximum caution or to exit the market to avoid sharp reversals against the preceding movement.
Beginners trading on the Forex market should remember that not every trade can be profitable. Developing a clear strategy and money management is key to long-term success in trading.


