


Analysis of Monday's Trades:
1H Chart of the EUR/USD Pair
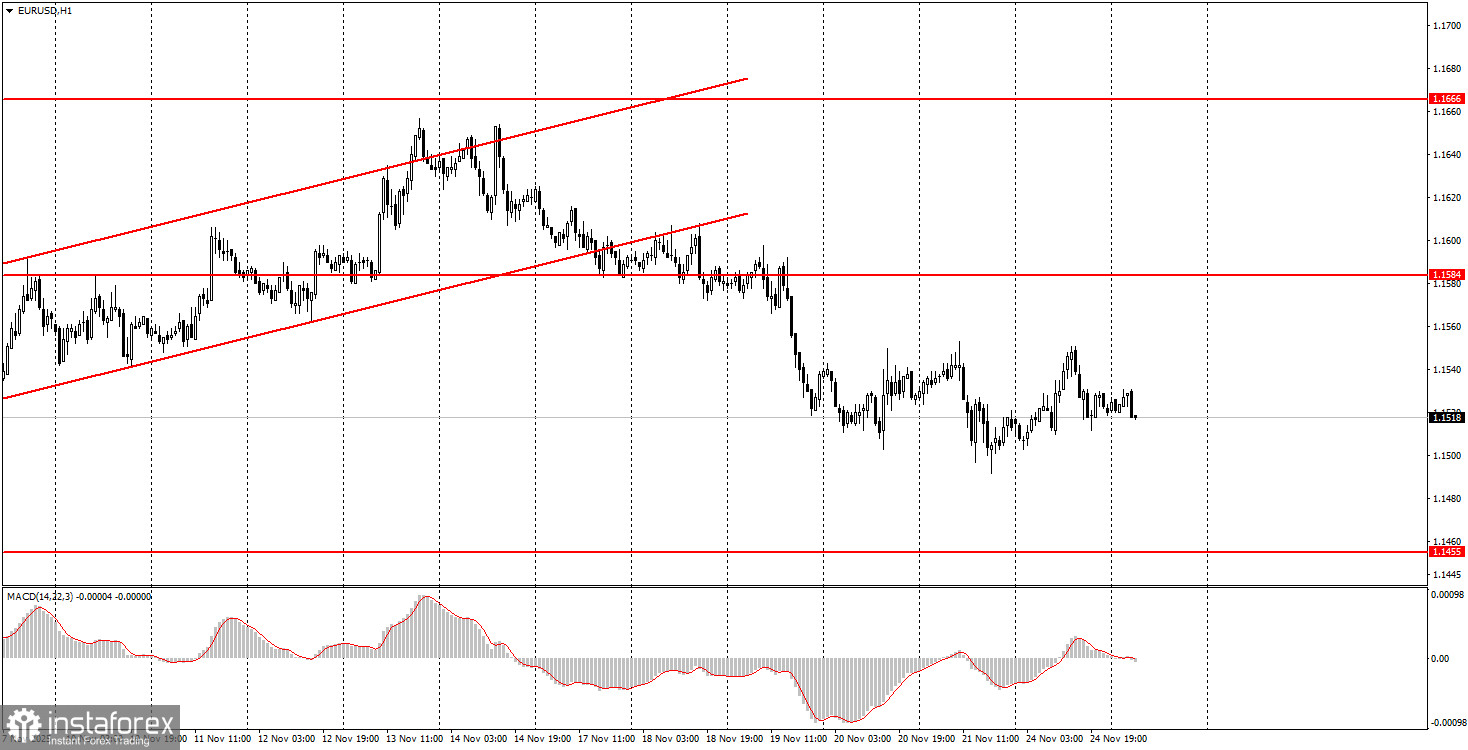
The EUR/USD currency pair attempted to resume its upward movement on Monday, but the result was another flat response. As we can see, market movements remain either absent or illogical. On Monday, they were virtually non-existent. The overall volatility for the day was below 50 pips, and the price remained within the range established on Friday. The macroeconomic backdrop was almost non-existent, except for a single German business climate index, which had no impact on the pair's movement. Fundamentals were also lacking. Meanwhile, the flat trend on the daily timeframe persists. It has continued for several months now, and there is currently no indication of its completion in the near future. Thus, we may continue to observe weak and illogical movements. Unfortunately, this is the objective reality when the market is flat. Currently, this flat is not just local but global.
5M Chart of the EUR/USD Pair
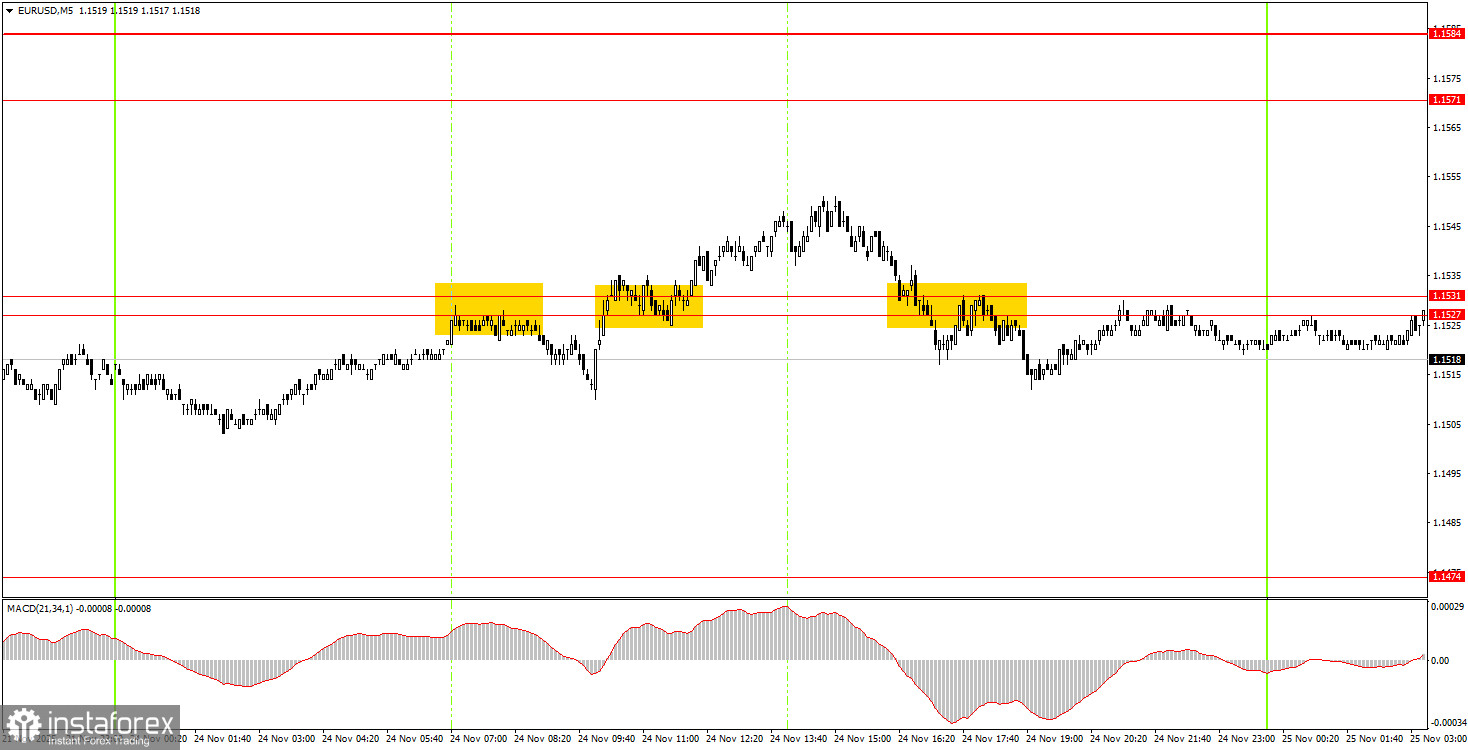
On the 5-minute timeframe, several trading signals were formed throughout Monday; however, understandable reasons prevented traders from realizing substantial profits. The pair initially bounced from the area of 1.1527-1.1531, then broke through it, and subsequently broke it again in the opposite direction. In each of these cases, the price moved in the correct direction for a maximum of about 15 pips. As we mentioned, the issue lies not in the trading signals or levels but in the lack of movement in the market.
How to Trade on Tuesday:
On the hourly timeframe, the EUR/USD pair is declining again and may be forming a new downward trend. The overall fundamental and macroeconomic backdrop remains very weak for the U.S. dollar, meaning the European currency can only decline on technical grounds—the flat trend on the daily timeframe remains relevant. However, we expect it to end and for the upward trend of 2025 to resume, with upward movements also occurring within the flat.
On Tuesday, beginner traders might once again trade from the area of 1.1527-1.1531, as there are no other options available. A price consolidation above this area will allow for long positions targeting 1.1571. A price bounce from this area makes short positions valid, targeting 1.1474.
On the 5-minute timeframe, the following levels should be considered: 1.1354-1.1363, 1.1413, 1.1455-1.1474, 1.1527-1.1531, 1.1571-1.1584, 1.1655-1.1666, 1.1745-1.1754, 1.1808, 1.1851, 1.1908, and 1.1970-1.1988. On Tuesday, no significant events are scheduled in the Eurozone, while three relatively important reports will be released in the U.S., including the Producer Price Index, retail sales, and the ADP report (weekly). While these are not the most critical releases, there are no other significant ones at this time. We expect a restrained market reaction to these reports.
Key Principles of My Trading System:
- The strength of the signal is considered based on the time taken to form the signal (bounce or breach of a level). The less time taken, the stronger the signal.
- If two or more trades have been opened around a certain level based on false signals, all subsequent signals from that level should be ignored.
- In a flat market, any pair can create numerous false signals or may not form them at all. In any case, it's best to stop trading at the first signs of a flat.
- Trading deals are opened during the period between the start of the European session and the middle of the American session, after which all deals should be closed manually.
- On the hourly timeframe, it is preferable to trade based on signals from the MACD indicator only when there is good volatility and a trend that is confirmed by a trend line or trend channel.
- If two levels are too close to each other (between 5 and 20 pips), they should be treated as an area of support or resistance.
- After a 15-pip move in the right direction, a Stop Loss should be set to breakeven.
What the Charts Show:
- Support and resistance price levels are targets for opening buy or sell positions. Take Profit levels can be placed around them.
- Red lines indicate trend channels or trend lines, reflecting the current trend and indicating the preferred trading direction.
- The MACD indicator (14,22,3) — histogram and signal line — is a supplementary indicator that can also be used as a source of signals.
Important announcements and reports (always available in the news calendar) can significantly impact the movement of the currency pair. Therefore, during their release, it is recommended to trade with maximum caution or to exit the market to avoid sharp reversals against the preceding movement.
Beginners trading on the Forex market should remember that not every trade can be profitable. Developing a clear strategy and money management is key to long-term success in trading.


