


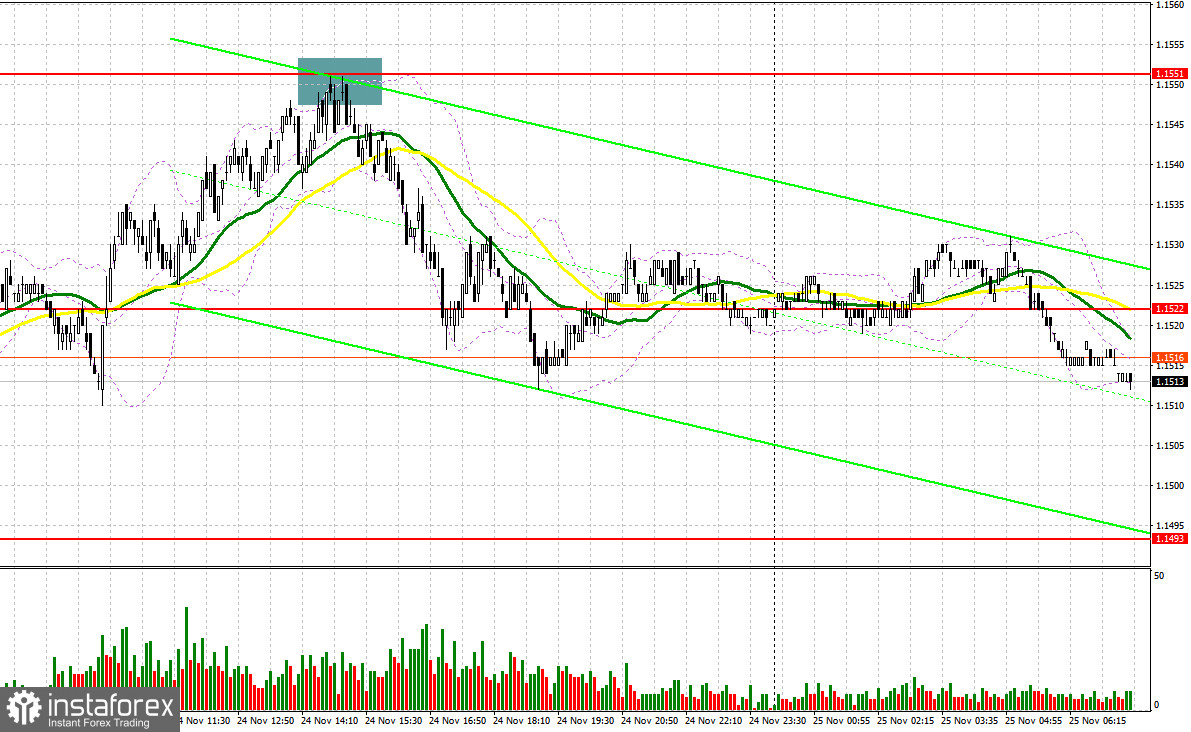
Several suitable entry points into the market were formed yesterday. Let's look at the 5-minute chart and analyze what happened. In my morning forecast, I highlighted the 1.1529 level and planned to base my decisions on it. The rise and formation of a false breakout around 1.1529 led to a sell entry for the euro; however, the pair did not fall as anticipated. In the afternoon, active bear movements around 1.1551 and the unsuccessful consolidation above it led to solid sales, with the pair returning to the support level of 1.1522.
To Open Long Positions on EUR/USD:
The lack of U.S. data weighed on the dollar, providing slight support to the euro in the afternoon. This morning, an interesting report on Germany's third-quarter GDP is scheduled for release. If GDP contracts for the second time, discussions about a high probability of recession in the Eurozone's leading economy next year will undoubtedly arise, putting pressure on the euro. In this case, I expect the first signs of buyers only around the support level of 1.1493, formed based on yesterday's data. A false breakout there will provide an entry point for long positions, targeting a recovery of the pair to the resistance level of 1.1522, where trading is currently taking place. A breakout and reverse test of this range will confirm the right actions for buying the euro, anticipating a larger surge towards 1.1551. The furthest target will be last week's high at 1.1584, at which point I will lock in profits. Testing this level will halt the bear market's development. In the event of a decline in EUR/USD and a lack of activity around 1.1493, pressure on the pair will only increase. Sellers will likely reach the next interesting level of 1.1472. Only if there is a false breakout will there be a suitable condition for buying the euro. Long positions will be opened immediately on the bounce from 1.1433, targeting an upward correction of 30-35 pips within the day.
To Open Short Positions on EUR/USD:
Sellers showed themselves yesterday from the upper boundary of the sideways channel. If there are good data from Germany and a positive market reaction, I expect the first signs of sellers today around the resistance level of 1.1522. A false breakout there will provide an entry point for short positions, targeting a move to support at 1.1493. A breakout and consolidation below this range, along with a reverse test from below, will create another suitable option for opening short positions, targeting the area of 1.1472, which will strengthen the bear trend. The furthest target will be the 1.1433 area, where I will lock in profits. If EUR/USD moves higher and there is a lack of active bearish action around 1.1522, where the moving averages are favoring sellers, buyers will have a good opportunity for another upward move. In this case, short positions are best postponed until the larger level of 1.1551 – the upper boundary of the sideways channel. Selling there will only occur after an unsuccessful consolidation. I plan to open short positions immediately on the bounce from 1.1584, targeting a 30-35-pip downward correction.
Recommendations for review:
Due to the shutdown in the U.S., fresh data on the Commitment of Traders is not being published. As soon as the relevant report is prepared, we will publish it immediately. The last available data is only from October 7.
In the COT report (Commitment of Traders), there was an increase in short positions and a reduction in long positions. Expectations of further rate cuts by the Federal Reserve continue to pressure the U.S. dollar. However, euro buyers are not increasing either, as political issues in France and the risks of a new surge in inflation force the ECB to act much more cautiously, slowing economic growth. The COT report indicates that long non-commercial positions decreased by 789 to 252,472, while short non-commercial positions increased by 2,625 to 138,625. As a result, the spread between long and short positions narrowed by 873.

Indicator Signals:
Moving Averages
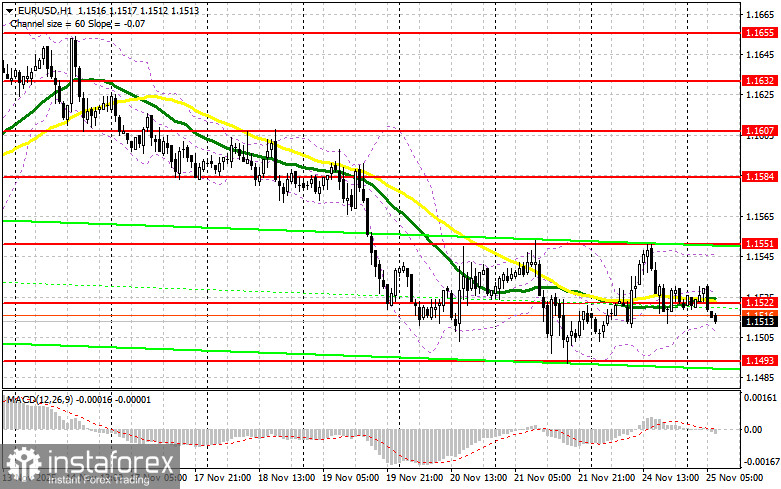
Trading occurs around the 30 and 50-day moving averages, indicating market uncertainty.
Note: The period and prices of the moving averages are considered by the author on the H1 hourly chart and differ from the general definition of classic daily moving averages on the D1 daily chart.
Bollinger Bands
In the event of a decline, the indicator's lower boundary around 1.1510 will serve as support.
Description of Indicators:
- Moving Average (MA): Determines the current trend by smoothing out volatility and noise. Period – 50. Highlighted in yellow on the chart.
- Moving Average (MA): Determines the current trend by smoothing out volatility and noise. Period – 30. Highlighted in green on the chart.
- MACD Indicator (Moving Average Convergence/Divergence): Fast EMA – period 12. Slow EMA – period 26. SMA – period 9.
- Bollinger Bands: Period – 20.
- Non-commercial Traders: Speculators such as individual traders, hedge funds, and large institutions that use the futures market for speculative purposes, meeting certain requirements.
- Long Non-commercial Positions: The total long open position of non-commercial traders.
- Short Non-commercial Positions: The total short open position of non-commercial traders.
- Total Non-commercial Net Position: The difference between the short and long positions of non-commercial traders.


