


Trade Analysis for Tuesday:
1H Chart of the EUR/USD Pair
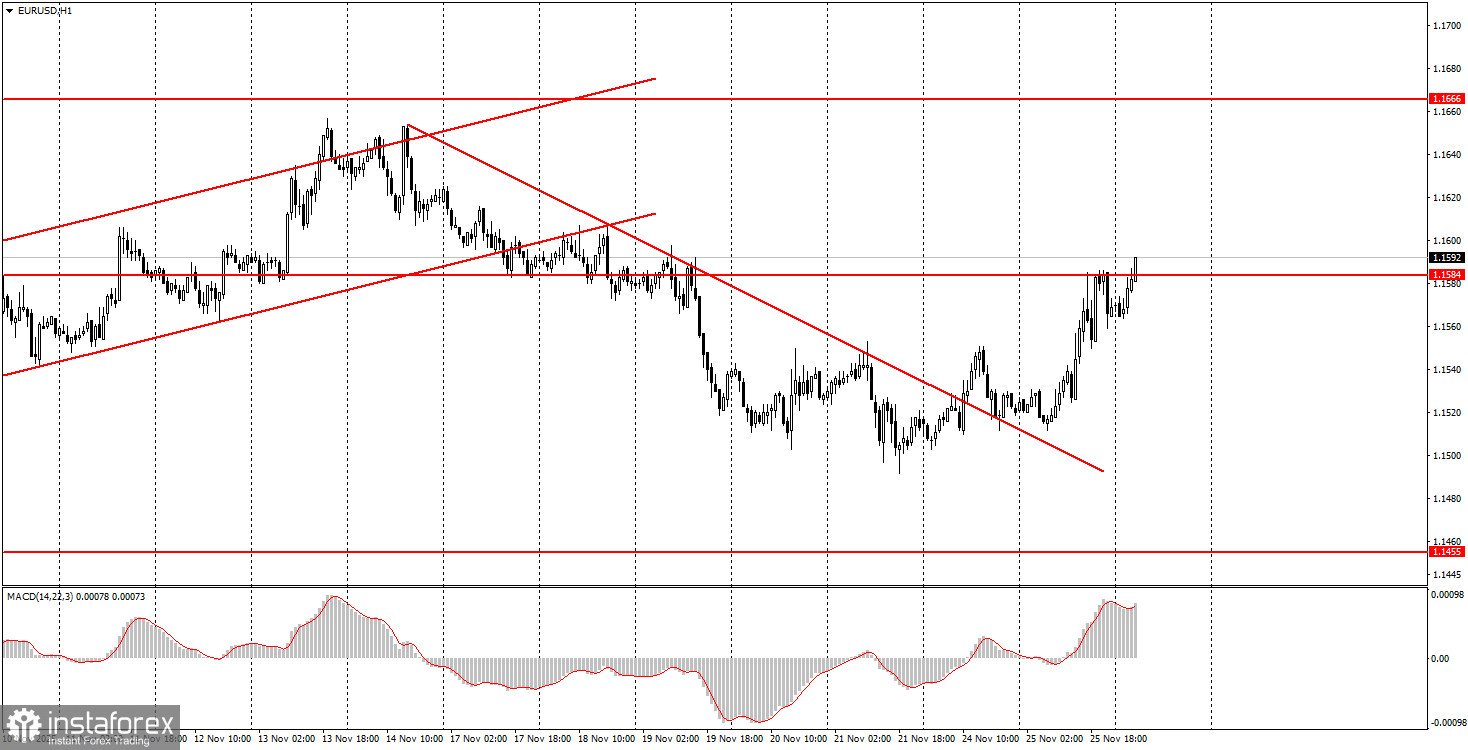
The EUR/USD currency pair finally demonstrated a logical upward movement on Tuesday. And it was reasonable in every sense of the word. Let's start with the technical aspect. The price broke through and overcame the descending trend line, so an upward trend was to be expected. On the daily timeframe, the pair reached the area of the lower boundary of the sideways channel at 1.1400-1.1830, thus growth could again be anticipated. From a macroeconomic perspective, three reports were published in the U.S. yesterday, and two of them can be definitively assigned as negative for the American dollar. While the producer price index was neutral, retail sales and the ADP employment report were worse than expected. Therefore, we saw a completely logical movement upwards in the second half of the day. We believe that this momentum should continue, given that global factors remain sharply negative for the dollar. Additionally, the upward trend for 2025 continues on the daily timeframe.
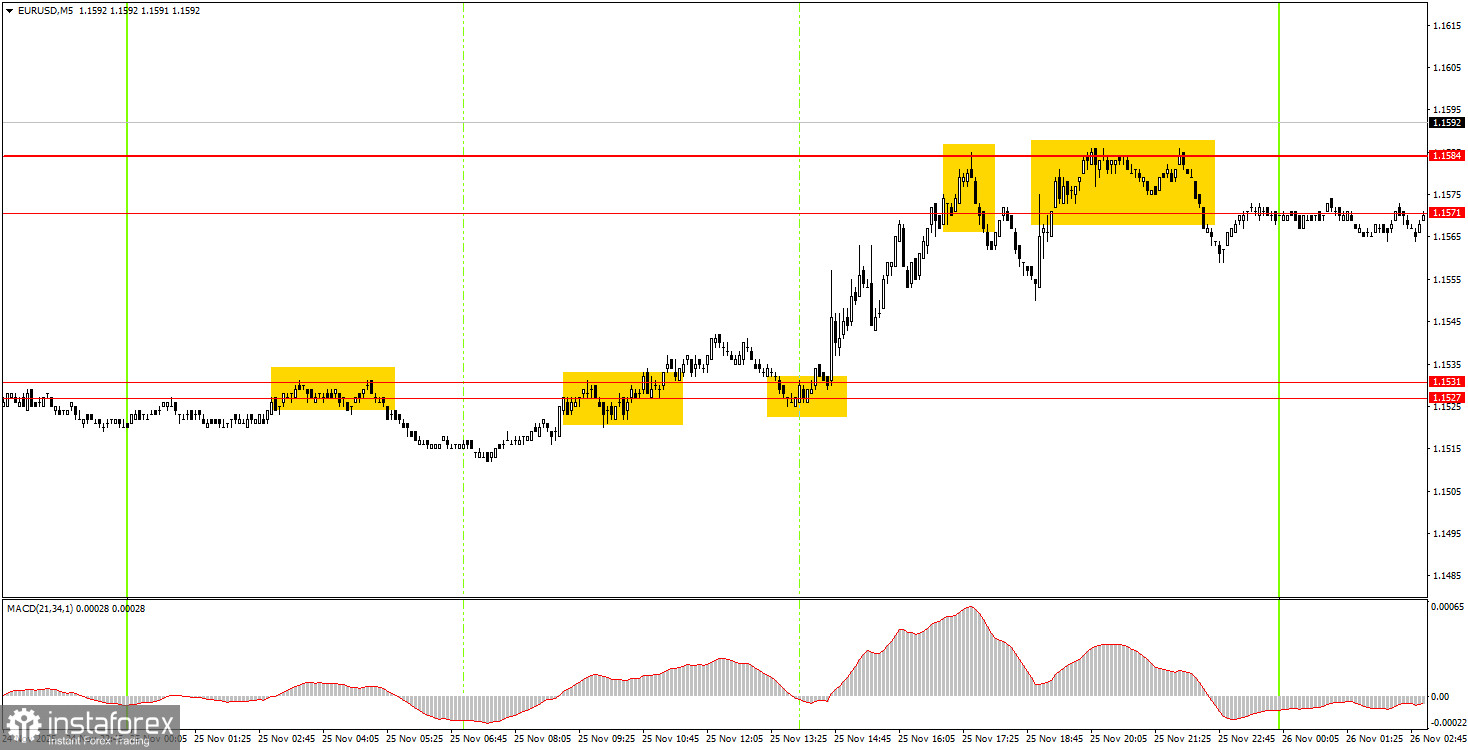
5M Chart of the EUR/USD Pair
How to Trade on Wednesday:
On the hourly timeframe, the EUR/USD pair has started another attempt to rise. The overall fundamental and macroeconomic background remains very weak for the U.S. dollar; therefore, the euro can only show declines based on technical factors, with the sideways movement on the daily timeframe still relevant. However, we expect it to conclude and the upward trend for 2025 to resume, while also experiencing upward movements within the sideways range.
On Wednesday, novice traders can once again trade from the area of 1.1571-1.1584. A price consolidation above this area will allow for the opening of new long positions targeting 1.1655-1.1666, which are now much more relevant than shorts. A price consolidation below this area will make short positions relevant with a target of 1.1531.
On the 5-minute timeframe, the following levels should be considered: 1.1354-1.1363, 1.1413, 1.1455-1.1474, 1.1527-1.1531, 1.1571-1.1584, 1.1655-1.1666, 1.1745-1.1754, 1.1808, 1.1851, 1.1908, 1.1970-1.1988. On Wednesday, no important events are scheduled in the Eurozone, while in the U.S., a report on durable goods orders will be published, which is considered significant enough to provoke a reaction from traders.
Key Principles of My Trading System:
- The strength of the signal is considered based on the time taken to form the signal (bounce or breach of a level). The less time taken, the stronger the signal.
- If two or more trades have been opened around a certain level based on false signals, all subsequent signals from that level should be ignored.
- In a flat market, any pair can create numerous false signals or may not form them at all. In any case, it's best to stop trading at the first signs of a flat.
- Trading deals are opened during the period between the start of the European session and the middle of the American session, after which all deals should be closed manually.
- On the hourly timeframe, it is preferable to trade based on signals from the MACD indicator only when there is good volatility and a trend that is confirmed by a trend line or trend channel.
- If two levels are too close to each other (between 5 and 20 pips), they should be treated as an area of support or resistance.
- After a 15-pip move in the right direction, a Stop Loss should be set to breakeven.
What the Charts Show:
- Support and resistance price levels are targets for opening buy or sell positions. Take Profit levels can be placed around them.
- Red lines indicate trend channels or trend lines, reflecting the current trend and indicating the preferred trading direction.
- The MACD indicator (14,22,3) — histogram and signal line — is a supplementary indicator that can also be used as a source of signals.
Important announcements and reports (always available in the news calendar) can significantly impact the movement of the currency pair. Therefore, during their release, it is recommended to trade with maximum caution or to exit the market to avoid sharp reversals against the preceding movement.
Beginners trading on the Forex market should remember that not every trade can be profitable. Developing a clear strategy and money management is key to long-term success in trading.


