


Trade Analysis of Tuesday:
1H Chart of the GBP/USD Pair
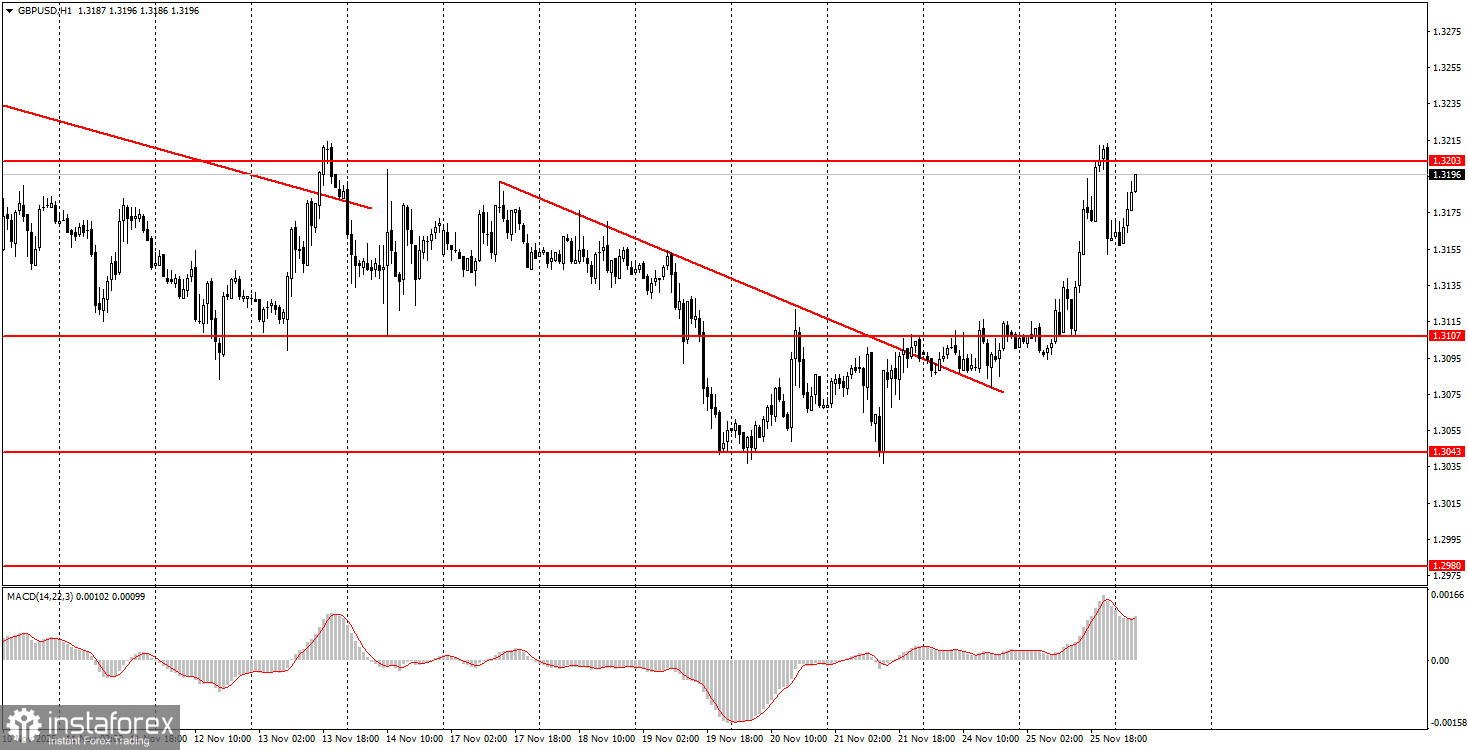
The GBP/USD pair also rose on Tuesday, driven by the same factors that were influencing the European currency. A few days ago, the descending trend line was broken; macroeconomic data yesterday were unfavorable for the US dollar; and, in the long term (despite a prolonged correction), an upward trend remains. The global fundamental backdrop remains favorable to the British pound, despite disappointing economic data over the last month and confusion about the 2026 budget. However, persistent budget issues cannot keep pulling down the British currency, and British data are currently not much worse than American ones, which are also faltering repeatedly. Thus, we continue to expect only growth from the pair. The question is whether the global downward correction on the daily timeframe has completed. If so, the ascent to the level of $1.40 begins now.
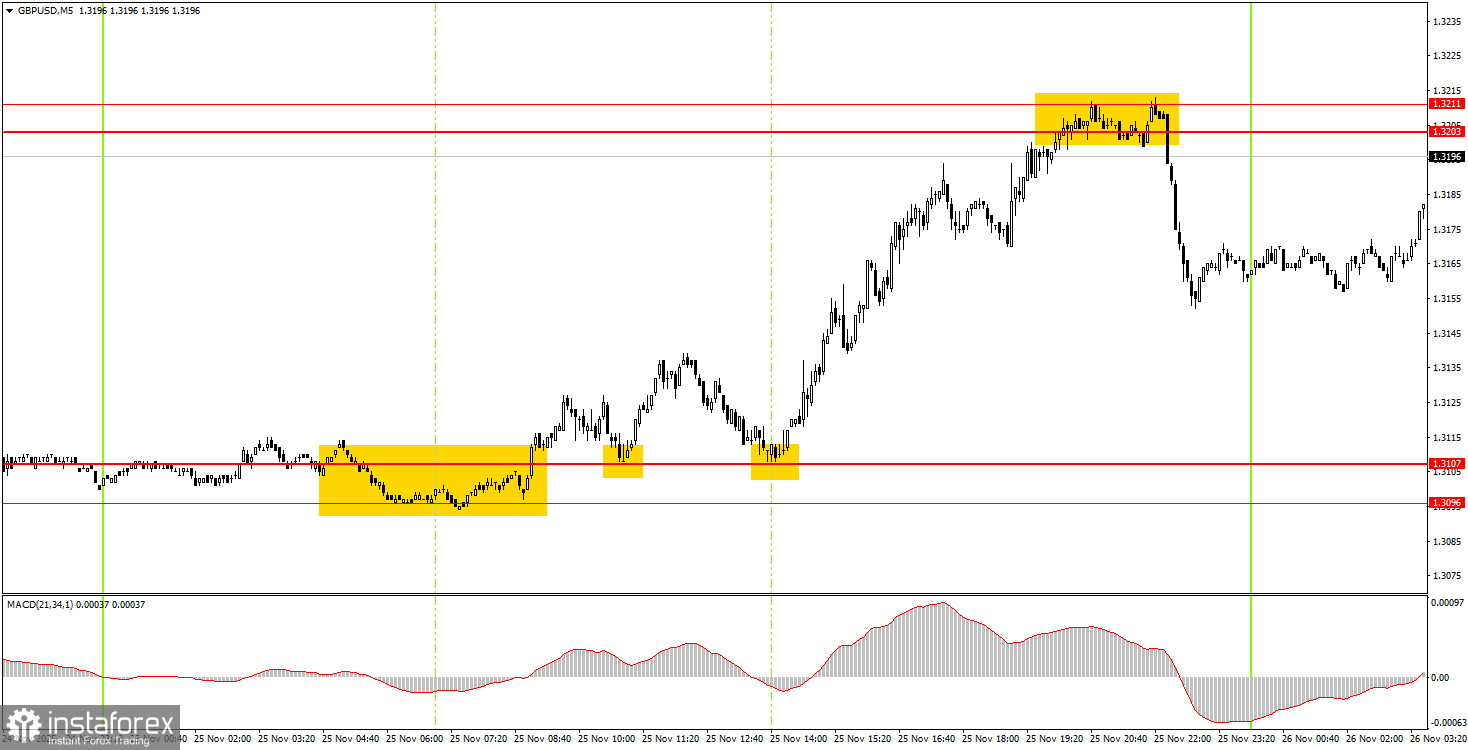
5M Chart of the GBP/USD Pair
How to Trade on Wednesday:
On the hourly timeframe, the GBP/USD pair completed another downward trend. An upward movement has begun, and we hope it will not end as quickly as all previous trends on the hourly timeframe. As we've mentioned, there are no global reasons for prolonged dollar strength, so in the medium term, we expect movement only to the upside. However, the correction/flat on the daily timeframe may not be over, and the local macroeconomic background regularly impacts the British pound, hindering traders from buying.
On Wednesday, novice traders can expect new trading signals to form in the 1.3203-1.3211 range. A price bounce from this area will allow for short positions targeting 1.3107, while a consolidation above it will mean long positions targeting 1.3259.
On the 5-minute timeframe, trading can currently be done at levels 1.2913, 1.2980-1.2993, 1.3043, 1.3096-1.3107, 1.3203-1.3211, 1.3259, 1.3329-1.3331, 1.3413-1.3421, 1.3466-1.3475, 1.3529-1.3543, 1.3574-1.3590. On Wednesday, there are no interesting events planned in the UK, while the US will release a fairly important report on durable goods orders.
Key Principles of My Trading System:
- The strength of the signal is considered based on the time taken to form the signal (bounce or breach of a level). The less time taken, the stronger the signal.
- If two or more trades have been opened around a certain level based on false signals, all subsequent signals from that level should be ignored.
- In a flat market, any pair can create numerous false signals or may not form them at all. In any case, it's best to stop trading at the first signs of a flat.
- Trading deals are opened during the period between the start of the European session and the middle of the American session, after which all deals should be closed manually.
- On the hourly timeframe, it is preferable to trade based on signals from the MACD indicator only when there is good volatility and a trend that is confirmed by a trend line or trend channel.
- If two levels are too close to each other (between 5 and 20 pips), they should be treated as an area of support or resistance.
- After a 20-pip move in the right direction, a Stop Loss should be set to breakeven.
What the Charts Show:
- Support and resistance price levels are targets for opening buy or sell positions. Take Profit levels can be placed around them.
- Red lines indicate trend channels or trend lines, reflecting the current trend and indicating the preferred trading direction.
- The MACD indicator (14,22,3) — histogram and signal line — is a supplementary indicator that can also be used as a source of signals.
Important announcements and reports (always available in the news calendar) can significantly impact the movement of the currency pair. Therefore, during their release, it is recommended to trade with maximum caution or to exit the market to avoid sharp reversals against the preceding movement.
Beginners trading on the Forex market should remember that not every trade can be profitable. Developing a clear strategy and money management is key to long-term success in trading.


