


Analysis of EUR/USD 5M
The EUR/USD currency pair experienced relatively good volatility for the second consecutive day on Wednesday. While we cannot say that the rise of the European currency was logical in terms of macroeconomic and fundamental factors, we have repeatedly stated that any upward movement at this moment is inherently logical, as the upward trend persists. Besides the upward trend, a flat pattern persists on the daily timeframe. Given that the price has dipped into the lower boundary (1.1400) twice in recent weeks, a reversal and purely technical growth was also plausible. Thus, yesterday's growth in the pair amid fairly decent U.S. statistics did not surprise us.
Before beginning to rise, the pair went down after the one U.S. report that was dollar-positive. Orders for durable goods in September increased by 0.5% instead of the expected 0.2%, which prompted a slight strengthening of the dollar. However, the dollar has clearly exhausted its streak of good luck in recent weeks as the market has ignored news over the past two months.
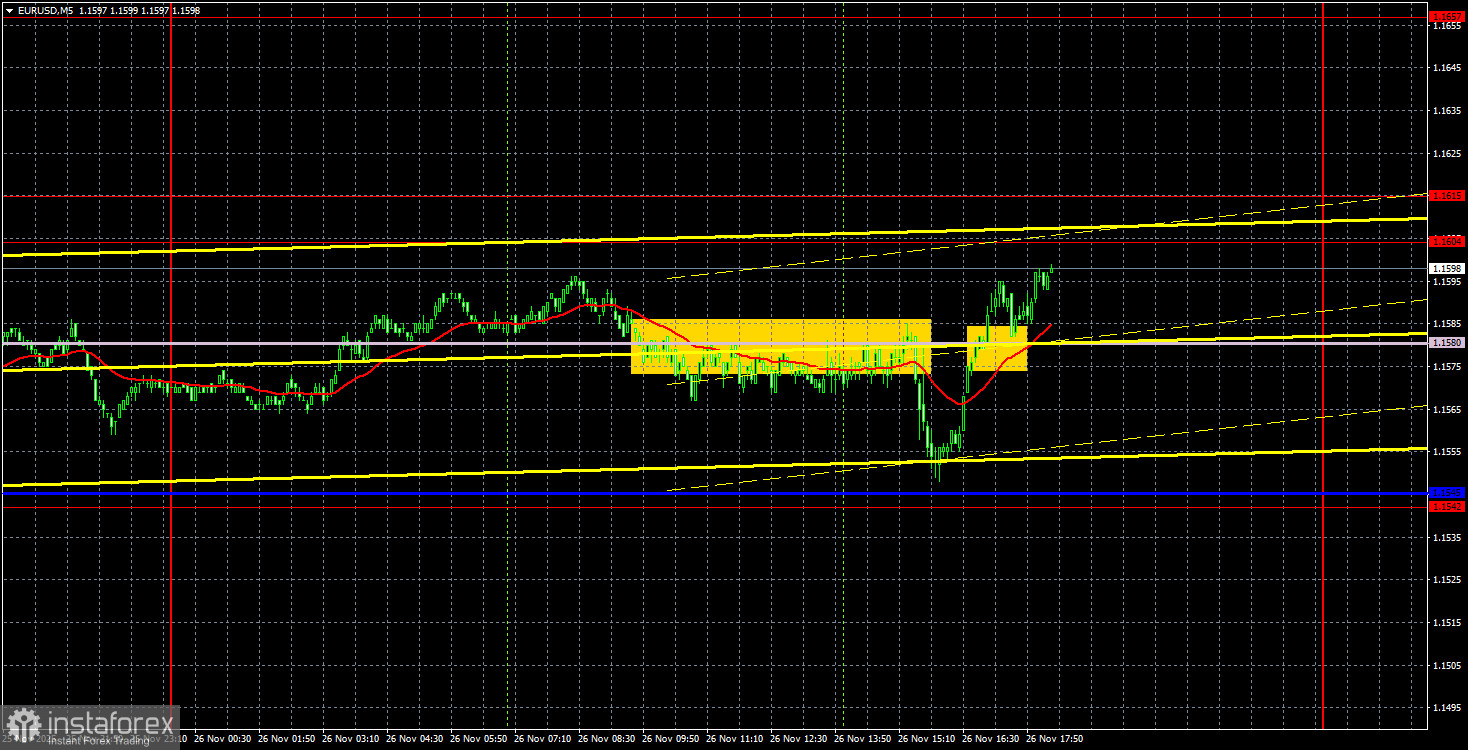
On the 5-minute timeframe, two trading signals were formed yesterday. First, the pair bounced off the Senkou Span B line, sending traders who, like us, were expecting growth into a panic. The price missed the Kijun-sen line by only a few pips, so the next signal was generated when the Senkou Span B line was breached. Whether it was worth opening long positions remains an open question, as the nearest target zone (1.1604-1.1615) was located nearby.
COT Report

The last COT report was published last week and is dated October 7, making it, to put it mildly, outdated. The illustration above clearly shows that the net position of non-commercial traders has long been "bullish." Bears barely entered the zone of their own superiority at the end of 2024 but quickly lost it again. Since Trump took office for a second time, the dollar has been falling. We cannot say with 100% certainty that the decline of the U.S. currency will continue, but current global developments hint at just such a scenario.
We still do not see any fundamental factors supporting the strengthening of the euro, but we do see enough factors supporting the decline of the dollar. The global downward trend still persists, but what significance does it have for the price movement over the last 17 years? The dollar could rise if the global fundamental picture changes, but currently, there are no signs of that.
The positions of the red and blue lines in the indicator continue to show a bullish trend. Over the last reporting week, the number of longs in the "Non-commercial" group increased by 3,300, while the number of shorts increased by 2,400. Consequently, the net position increased by 900 contracts over the week. However, this data is already outdated and irrelevant.
Analysis of EUR/USD 1H
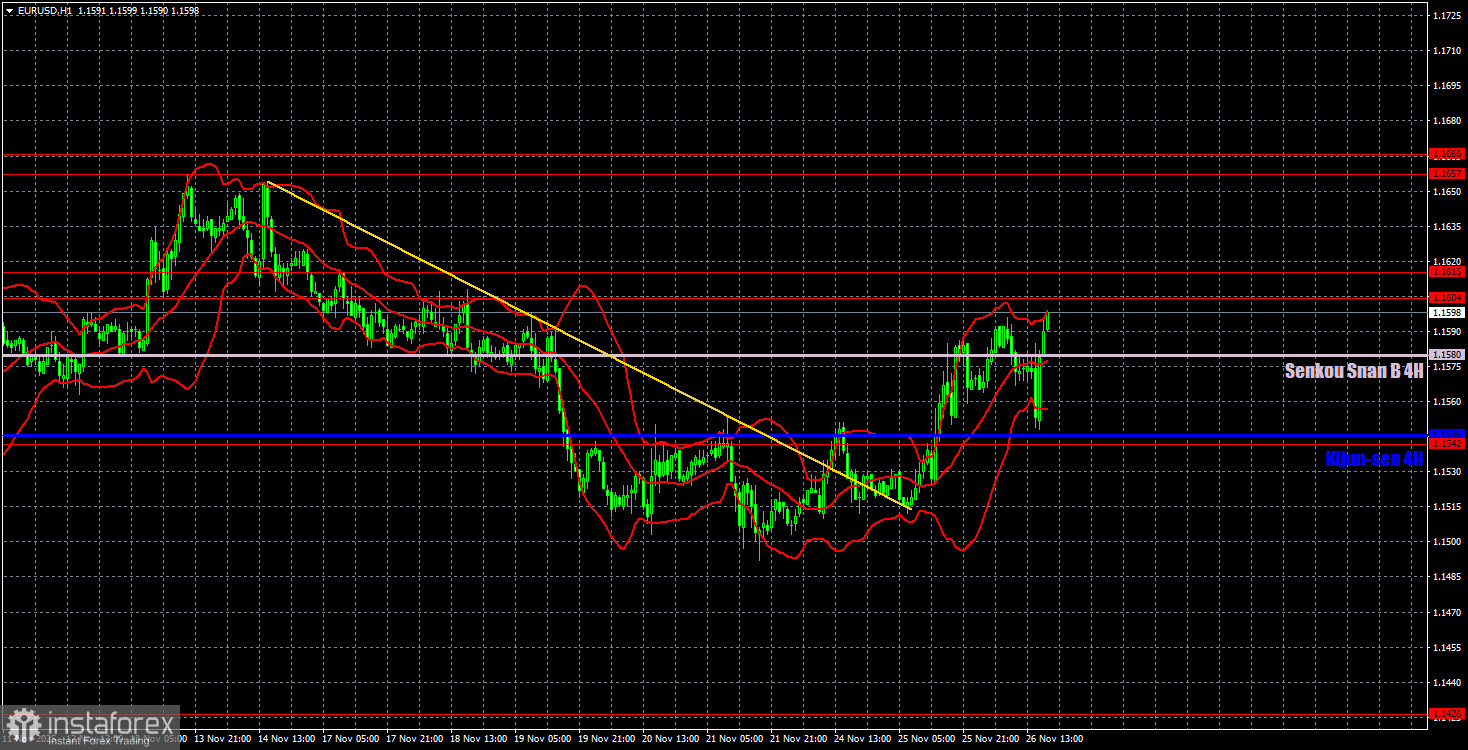
On the hourly timeframe, the EUR/USD pair has started to form an upward trend and has partially overcome the Senkou Span B line. The price remains within the sideways channel of 1.1400-1.1830 on the daily timeframe, so a rise of the euro to around 1.1800 may still occur even within the local trend. While the growth of the euro cannot be deemed strong, movements within a flat pattern are typically random and chaotic.
For November 27, we identify the following trading levels: 1.1234, 1.1274, 1.1362, 1.1426, 1.1542, 1.1604-1.1615, 1.1657-1.1666, 1.1750-1.1760, 1.1846-1.1857, 1.1922, 1.1971-1.1988, as well as the Senkou Span B line (1.1580) and the Kijun-sen line (1.1545). The Ichimoku indicator lines may shift throughout the day, which should be taken into account when determining trading signals. Don't forget to set stop-loss orders to break even if the price moves in the desired direction by 15 pips. This will protect against potential losses if the signal turns out to be false.
On Thursday, there are no significant events scheduled in either the European Union or the U.S. Therefore, volatility may remain minimal. If the euro continues to rise without news support, it will be a very good sign for the resumption of the global trend of 2025.
Trading Recommendations:
On Thursday, traders can trade from the area of 1.1604-1.1615. In the event of a rebound from this area, new sell opportunities can be considered with targets at the Senkou Span B line and the Kijun-sen line. In the event of a breakout of the area, buying can be considered with a target of 1.1657-1.1666.
Explanations for the Illustrations:
- Support and resistance price levels are indicated by thick red lines, where price movement may halt. They are not sources of trading signals.
- The Kijun-sen and Senkou Span B lines are lines of the Ichimoku indicator that are transferred from the 4-hour timeframe to the hourly timeframe. They are strong lines.
- Extremum levels are thin red lines from which the price has previously bounced. They are sources of trading signals.
- Yellow lines are trend lines, trend channels, and any other technical patterns.
- Indicator 1 on the COT charts represents the size of the net position of each category of traders.


