


Analysis of Wednesday's Trades:
1H Chart of the EUR/USD Pair
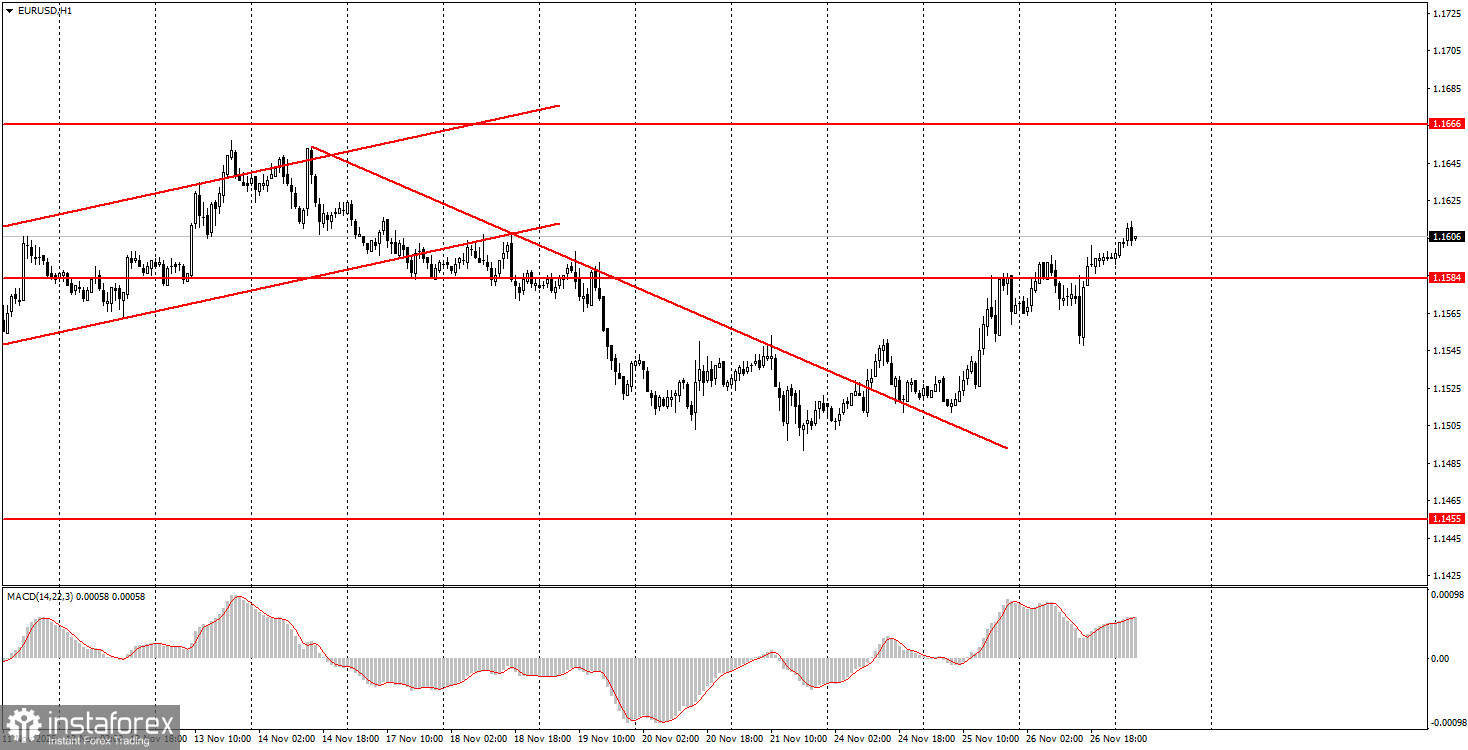
The EUR/USD currency pair continued its upward movement on Wednesday, despite experiencing a decline during the day. The macroeconomic background was relatively weak. Essentially, there was only one report to highlight—durable goods orders in the U.S., which, as expected, prompted a market reaction but did not significantly affect overall markets. What did we observe? The report came out more positively than anticipated, which led to a predictable rise in the dollar. However, the trend on the hourly timeframe shifted upward a few days ago, the daily timeframe remains flat, and the global trend continues to be upward. Thus, the price simply pulled back slightly and resumed its movement upward. We still believe that in the short and medium term, the European currency will continue to rise, since in the short term, the price dropped to the lower boundary of the range 1.1400-1.1830, while a long-term upward trend remains intact.
5M Chart of the EUR/USD Pair
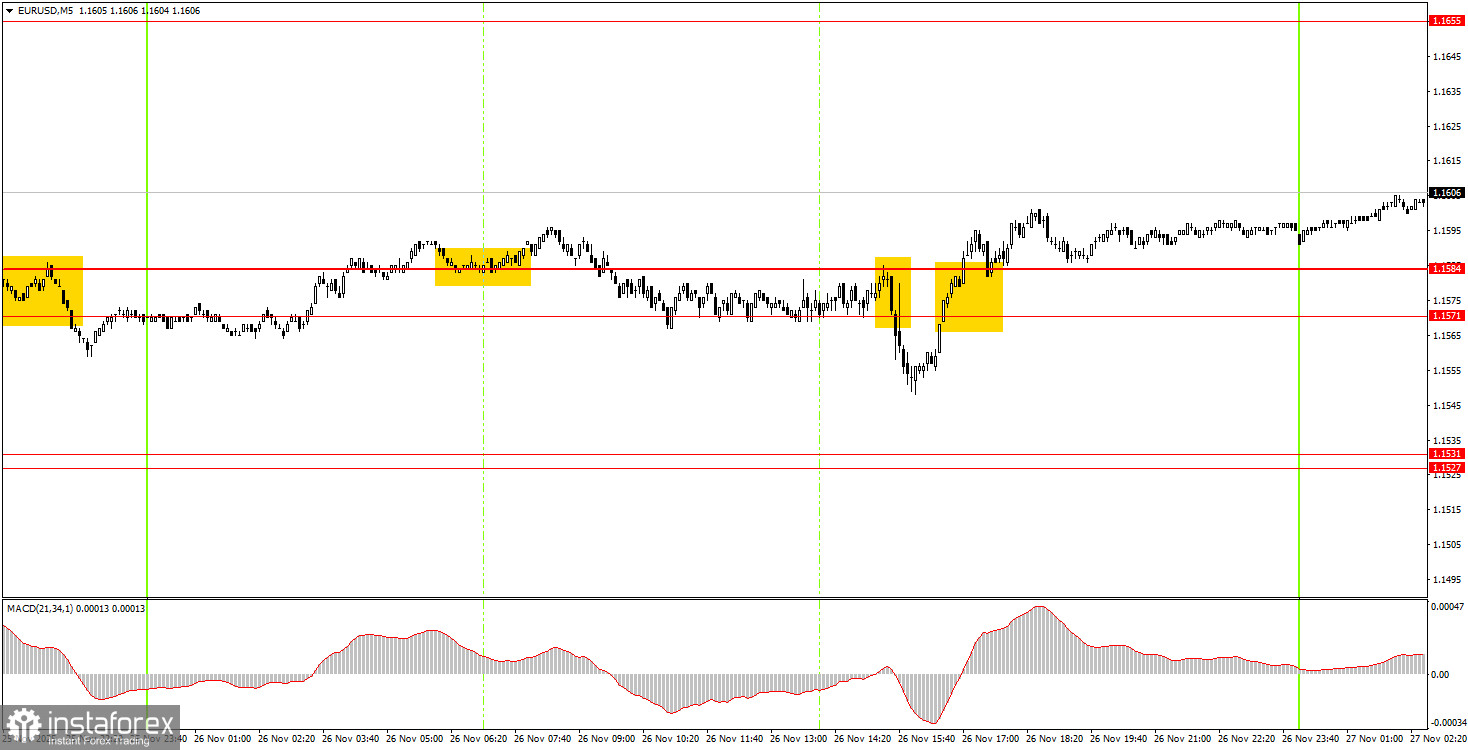
On the 5-minute timeframe, at least three trading signals were generated on Wednesday. Initially, the pair bounced off the level of 1.1584, then consolidated below the area of 1.1571-1.1584. Both signals turned out to be false, with the second one triggered by macroeconomic data. The third buy signal in the area of 1.1571-1.1584 did not trigger a strong move in the desired direction, though it is not yet considered a false signal – upward movement may continue today, and long positions can be kept open. Essentially, the U.S. orders report only disrupted the technical picture for Wednesday.
How to Trade on Thursday:
On the hourly timeframe, the EUR/USD pair has begun another attempt to rise. The overall fundamental and macroeconomic background remains very weak for the U.S. dollar, meaning the European currency can still experience declines only on technical grounds—the flat on the daily timeframe remains relevant. However, we anticipate its conclusion and the resumption of the upward trend in 2025.
On Thursday, beginner traders can trade once again from the area of 1.1571-1.1584. A price consolidation above this area would allow for opening long positions with a target of 1.1655-1.1666. A new bounce from this area would provide another opportunity to open longs. A consolidation below this area would make short positions relevant, with a target at 1.1531.
On the 5-minute timeframe, levels to consider are 1.1354-1.1363, 1.1413, 1.1455-1.1474, 1.1527-1.1531, 1.1571-1.1584, 1.1655-1.1666, 1.1745-1.1754, 1.1808, 1.1851, 1.1908, 1.1970-1.1988. On Thursday, no significant events are scheduled in either the European Union or the U.S. Therefore, volatility today may be low, but the pair may continue its upward movement.
Key Principles of My Trading System:
- The strength of the signal is considered based on the time taken to form the signal (bounce or breach of a level). The less time taken, the stronger the signal.
- If two or more trades have been opened around a certain level based on false signals, all subsequent signals from that level should be ignored.
- In a flat market, any pair can create numerous false signals or may not form them at all. In any case, it's best to stop trading at the first signs of a flat.
- Trading deals are opened during the period between the start of the European session and the middle of the American session, after which all deals should be closed manually.
- On the hourly timeframe, it is preferable to trade based on signals from the MACD indicator only when there is good volatility and a trend that is confirmed by a trend line or trend channel.
- If two levels are too close to each other (between 5 and 20 pips), they should be treated as an area of support or resistance.
- After a 15-pip move in the right direction, a Stop Loss should be set to breakeven.
What the Charts Show:
- Support and resistance price levels are targets for opening buy or sell positions. Take Profit levels can be placed around them.
- Red lines indicate trend channels or trend lines, reflecting the current trend and indicating the preferred trading direction.
- The MACD indicator (14,22,3) — histogram and signal line — is a supplementary indicator that can also be used as a source of signals.
Important announcements and reports (always available in the news calendar) can significantly impact the movement of the currency pair. Therefore, during their release, it is recommended to trade with maximum caution or to exit the market to avoid sharp reversals against the preceding movement.
Beginners trading on the Forex market should remember that not every trade can be profitable. Developing a clear strategy and money management is key to long-term success in trading.


