


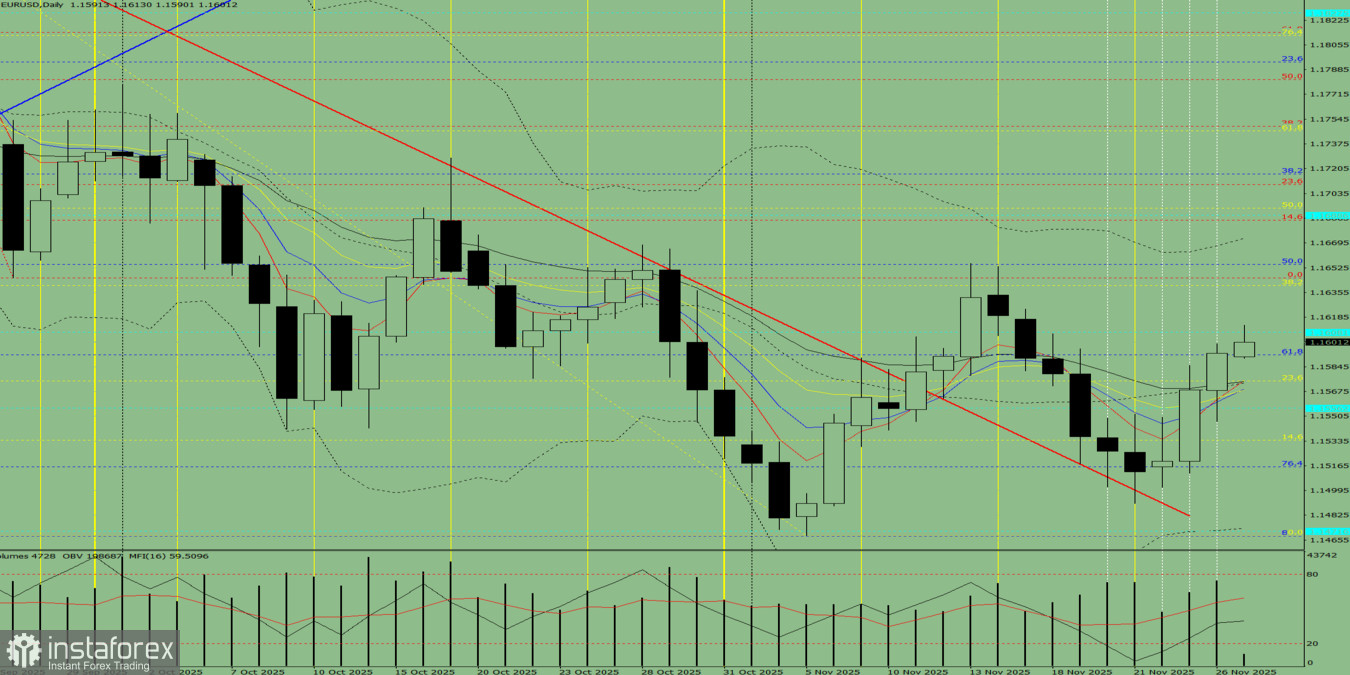
Fig. 1 (Daily Chart).
Composite Analysis:
- Indicator analysis — upward
- Fibonacci levels — upward
- Volumes — upward
- Candlestick analysis — upward
- Trend analysis — upward
- Bollinger Bands — upward
- Weekly chart — upward
Overall conclusion: Uptrend.
Alternative Scenario:On Thursday, the market may continue upward from the 1.1594 level (yesterday's daily candle close), targeting 1.1608, the historical resistance level (blue dashed line). When testing this level, the price may roll back downward toward 1.1556, the historical support level (blue dashed line).


