


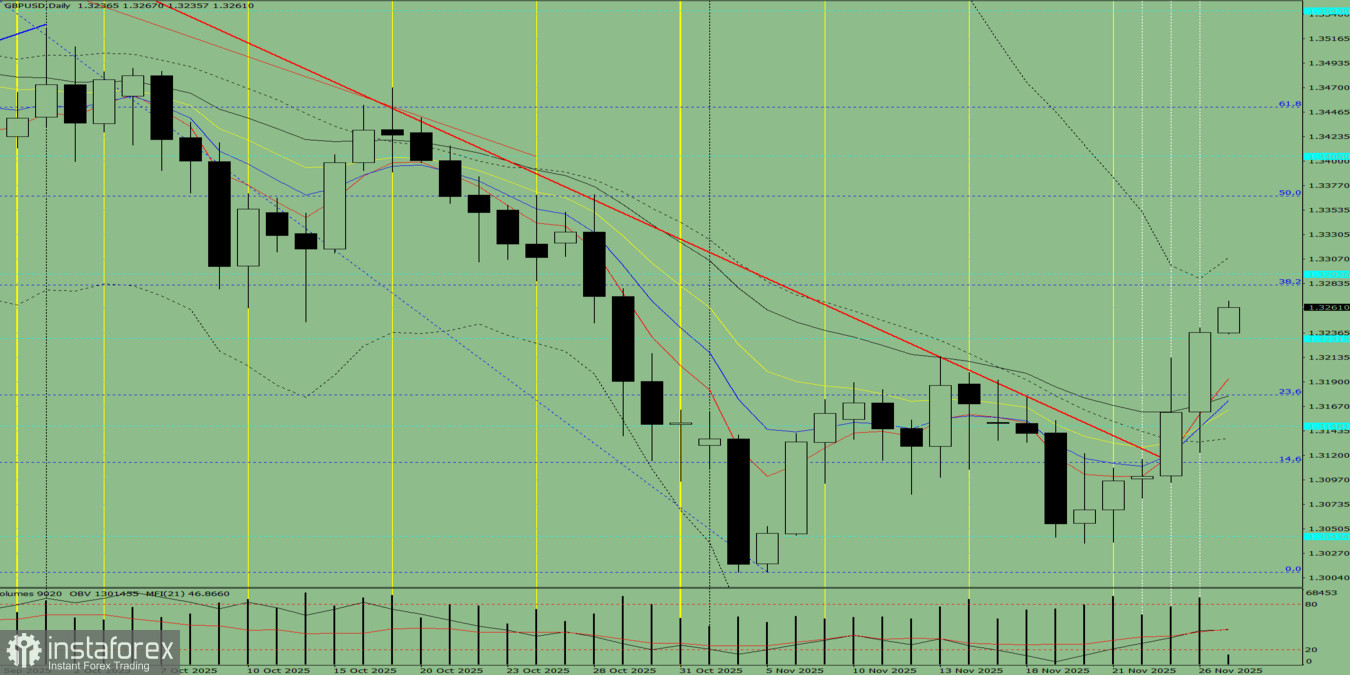
Fig. 1 (Daily Chart).
Composite Analysis:
- Indicator analysis — upward
- Fibonacci levels — upward
- Volumes — upward
- Candlestick analysis — upward
- Trend analysis — upward
- Bollinger Bands — upward
- Weekly chart — upward
Overall conclusion: Uptrend.
Alternative Scenario:From the 1.3237 level (yesterday's daily candle close), the price may continue moving upward, targeting 1.3282, the 38.2% retracement level (blue dashed line). From this level, the price may possibly roll back downward toward 1.3193, the 5-period EMA (thin red line).


