


Trend Analysis (Fig. 1).
On Friday, the market may start moving downward from the level of 1.3237 (yesterday's daily candle close) with a target of 1.3178 — the 23.6% retracement level (blue dashed line). When testing this level, a corrective upward movement is possible with a target of 1.3197 — the 5 EMA (thin red line).
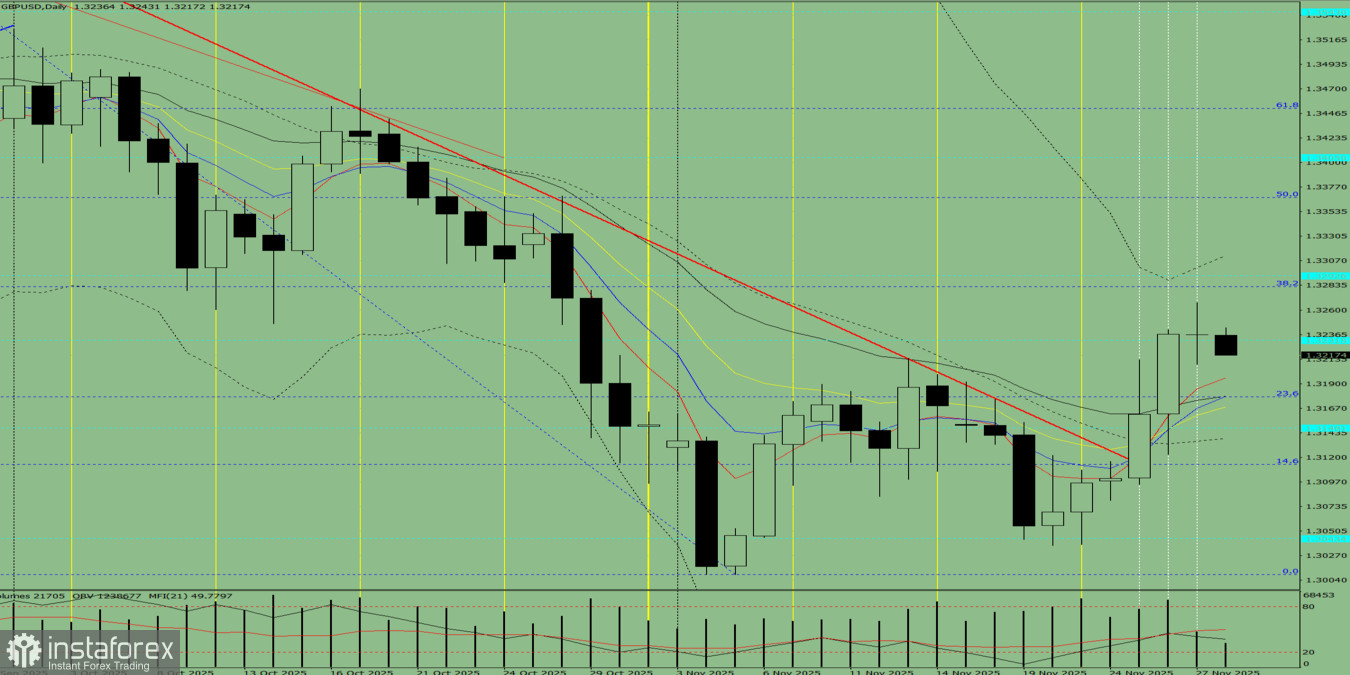
Fig. 1 (daily chart).
Comprehensive Analysis:
- indicator analysis – down
- Fibonacci levels – down
- volumes – down
- candlestick analysis – down
- trend analysis – down
- Bollinger Bands – down
- weekly chart – up
Overall conclusion: downward trend.
Alternative scenario: From the level of 1.3237 (yesterday's daily candle close), the price may begin moving downward with a target of 1.3197 — the 5 EMA (thin red line).
When testing this line, a corrective upward movement is possible with a target of 1.3209 — the lower fractal (daily candle of November 27, 2025).


