


Trade Analysis and Recommendations for the Japanese Yen
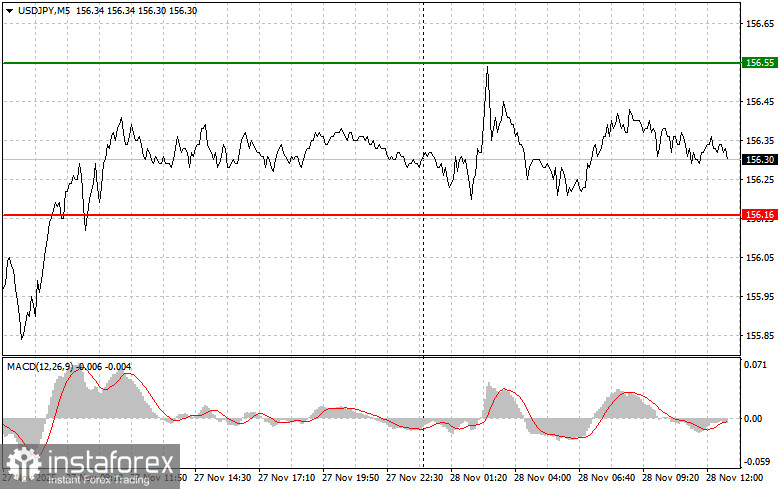
Because of low volatility, the price did not reach the levels I indicated during the first half of the day.
In the absence of further catalysts that determine price direction, USD/JPY may show consolidation, relying on current support and resistance levels. Traders using intraday strategies can take advantage of this situation to profit from small range-bound fluctuations. However, despite the expected stability in the second half of the day, it is important to remember that unexpected news or geopolitical events can disrupt the balance. Therefore, monitoring the rhetoric and actions of central banks becomes an important factor in forecasting the pair's future movement. Any hints of changes in monetary policy can trigger sharp price swings.
As for the intraday strategy, I will rely primarily on scenarios #1 and #2.
Buy Signal
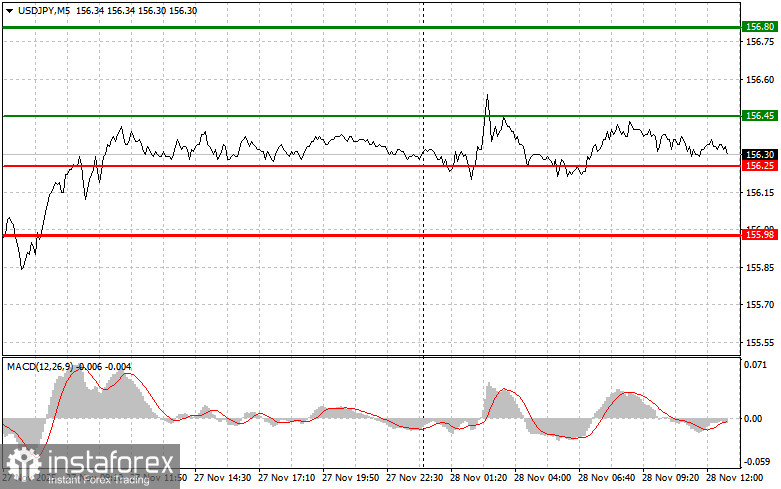
Scenario #1: Today, I plan to buy USD/JPY when the entry point around 156.45 (green line on the chart) is reached, aiming for growth to 156.80 (the thicker green line on the chart). Near 156.80, I will exit long positions and open short positions in the opposite direction (expecting a 30–35-point movement back from the level). A rise in the pair is possible as a continuation of the bullish market. Important! Before buying, make sure the MACD indicator is above the zero line and is just beginning to rise from it.
Scenario #2: I also plan to buy USD/JPY today if the price 156.25 is tested twice in a row at a moment when the MACD indicator is in the oversold zone. This will limit the pair's downward potential and lead to a reversal upward. Growth to the opposing levels of 156.45 and 156.80 can be expected.
Sell Signal
Scenario #1: Today, I plan to sell USD/JPY after the level 156.25 (red line on the chart) is renewed, which will lead to a rapid decline of the pair. The key target for sellers will be 155.98, where I will exit the short position and immediately open a buy position in the opposite direction (expecting a 20–25-point movement back from the level). Continued pressure on the pair today is unlikely. Important! Before selling, make sure the MACD indicator is below the zero line and is just beginning its downward movement from it.
Scenario #2: I also plan to sell USD/JPY today if the price 156.45 is tested twice in a row while the MACD indicator is in the overbought zone. This will limit the pair's upward potential and lead to a reversal downward. A decline to the opposing levels of 156.25 and 155.98 can be expected.
What's on the chart:
- Thin green line – entry price at which the trading instrument can be bought
- Thick green line – estimated price for placing Take Profit or manually taking profit, as further growth above this level is unlikely
- Thin red line – entry price at which the trading instrument can be sold
- Thick red line – estimated price for placing Take Profit or manually taking profit, as further decline below this level is unlikely
- MACD indicator – when entering the market, it is important to rely on overbought and oversold zones
Important
Beginner Forex traders need to make market-entry decisions very cautiously. Before major fundamental reports are released, it is best to stay out of the market to avoid sharp price swings. If you choose to trade during news releases, always place stop orders to minimize losses. Without stop orders, you can very quickly lose your entire deposit — especially if you do not use money management and trade large volumes.
And remember: for successful trading, you must have a clear trading plan, like the one presented above. Spontaneous trading decisions based on the current market situation are an inherently losing strategy for an intraday trader.


