


Meanwhile, Bitcoin has returned to the $92,000 area and has even surpassed this level, making it the perfect time to continue the conversation about Solana and its dominance in the market for tokenized stocks.
This morning, I discussed how Solana currently dominates the market for the offering and trading of tokenized stocks, holding more than a 95% market share for the past four months. In October of this year, that share even reached as high as 99%.
Leading crypto enthusiasts have picked up on this subject. In an interview, American entrepreneur and co-founder and former CEO of the cryptocurrency exchange BitMEX, Arthur Hayes, stated that by the end of 2026, the pricing of major US stocks will shift from Wall Street to the on-chain space. In his view, the market will look to perpetual contract charts rather than NASDAQ.
Arthur Hayes argues that blockchain offers a far more efficient and transparent infrastructure for trading tokens representing stocks. The absence of intermediaries, instantaneous trade execution, and round-the-clock accessibility are key factors that are drawing investors toward on-chain trading. Additionally, the decentralized nature of blockchain reduces the risks of market manipulation and enhances overall trust in the system.
However, not everyone shares Hayes' optimism. Critics point to the regulatory hurdles that need to be overcome for the mass adoption of tokenized stocks. Scalability and security issues also need to be considered. Solana, despite its advantages, is not without vulnerabilities, and successful hacking attacks could undermine trust in the platform. Furthermore, significant technological advancements will be required to handle transaction volumes comparable to those of NASDAQ.
Nevertheless, the trend toward asset tokenization is evident and gaining momentum.
Trading recommendations
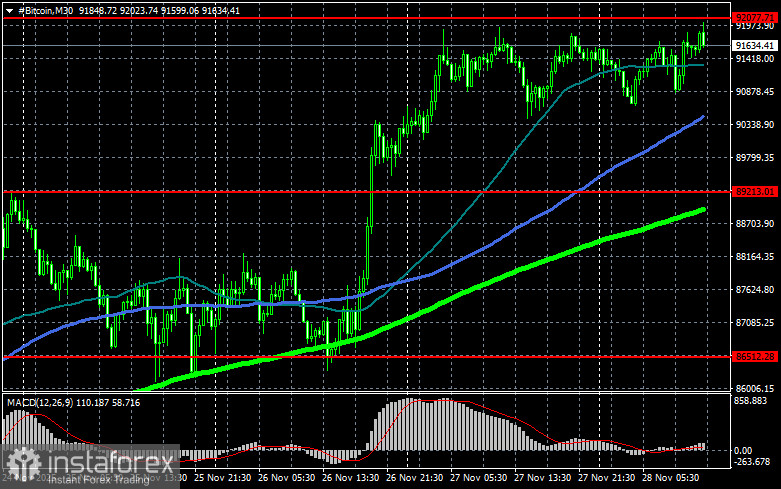
Regarding the technical picture of Bitcoin, buyers are now targeting a return to the $92,000 level, which opens a direct path to $92,500, and from there it is just a short distance to $99,400. The furthest target will be around $101,400; overcoming this level would signify attempts to return to a bull market. In the event of a Bitcoin decline, I expect buyers at the level of $89,200. A return of the trading instrument below this area could quickly drop BTC to around $86,500. The furthest target will be the area of $83,900.
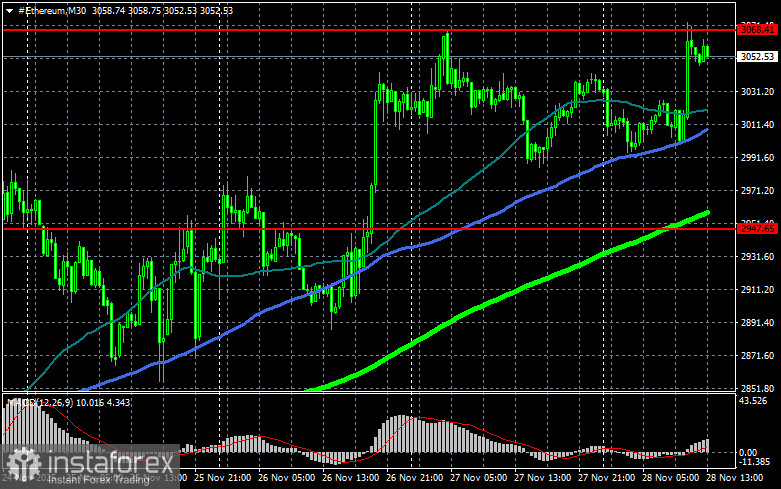
As for the technical picture of Ethereum, establishing a clear position above $3,068 opens a direct path to $3,193. The furthest target will be the peak around $3,317; breaching this level would indicate a strengthening of bullish market sentiment and renewed interest from buyers. In case of a decline in Ethereum, I expect buyers at the level of $2,947. A return of the trading instrument below this area could quickly drop ETH to around $2,845. The furthest target will be the area of $2,732.
What's on the chart
- Red lines represent support and resistance levels, where price is expected to either pause or react sharply.
- The green line shows the 50-day moving average.
- The blue line is the 100-day moving average.
- The lime line is the 200-day moving average.
Price testing or crossing any of these moving averages often either halts movement or injects fresh momentum into the market.


