


Trend Analysis (Fig. 1)
On Tuesday, from the level of 1.1608 (yesterday's daily candle close), the market may continue moving downward toward the target of 1.1575 — the 23.6% retracement level (yellow dashed line). When testing this level, the price may possibly rebound upward with the target of testing the 61.8% retracement level at 1.1592 (blue dashed line).
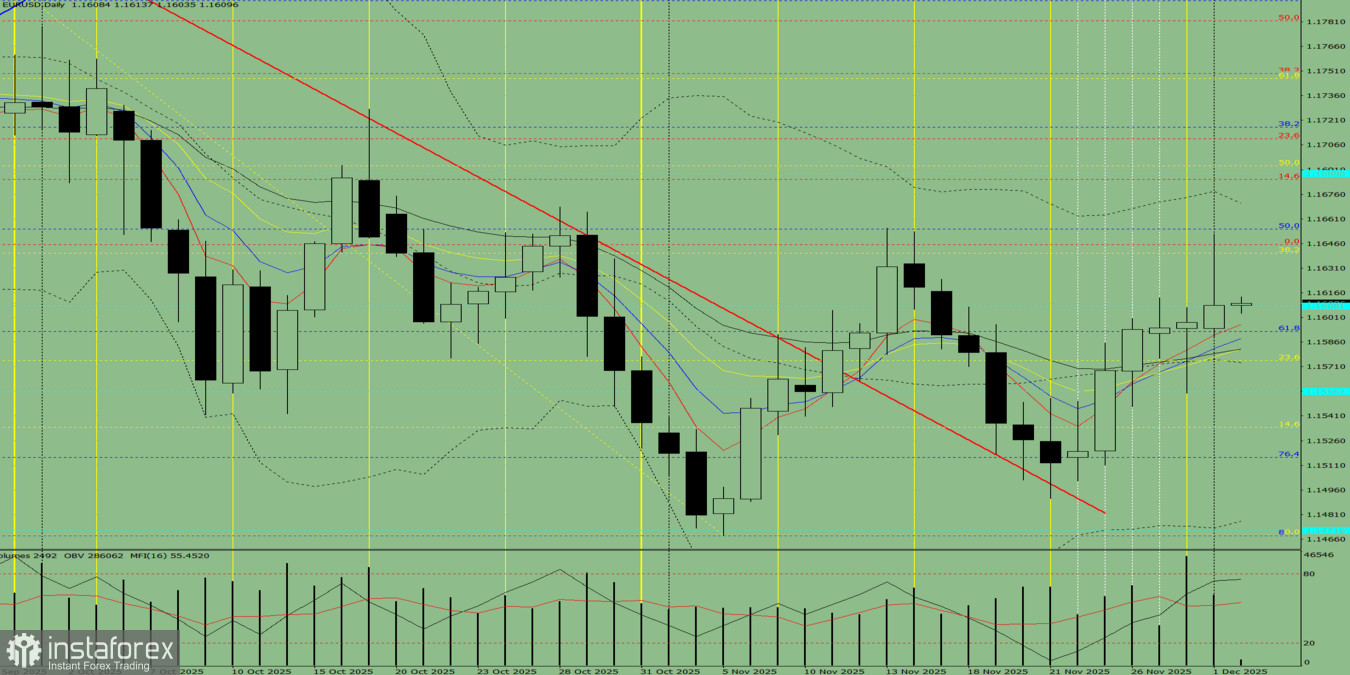
Fig. 1 (daily chart)
Comprehensive Analysis:
- indicator analysis — down;
- volume analysis — down;
- candlestick analysis — down;
- trend analysis — down;
- Bollinger Bands — down;
- weekly chart — down.
Overall conclusion: a downward trend.
Alternative scenario:From the level of 1.1608 (yesterday's daily candle close), the price may continue moving downward toward the target of 1.1556 — a historical support level (light-blue dashed line). Upon testing this level, the price may possibly rebound upward toward 1.1575 — the 23.6% retracement level (yellow dashed line).


