


Trend Analysis (Fig. 1)
On Tuesday, from the level of 1.3208 (yesterday's daily candle close), the market may continue moving downward toward the target of 1.3148 — a historical resistance level (light-blue dashed line). When testing this level, the price may possibly begin moving upward toward 1.3178 — the 23.6% retracement level (blue dashed line).
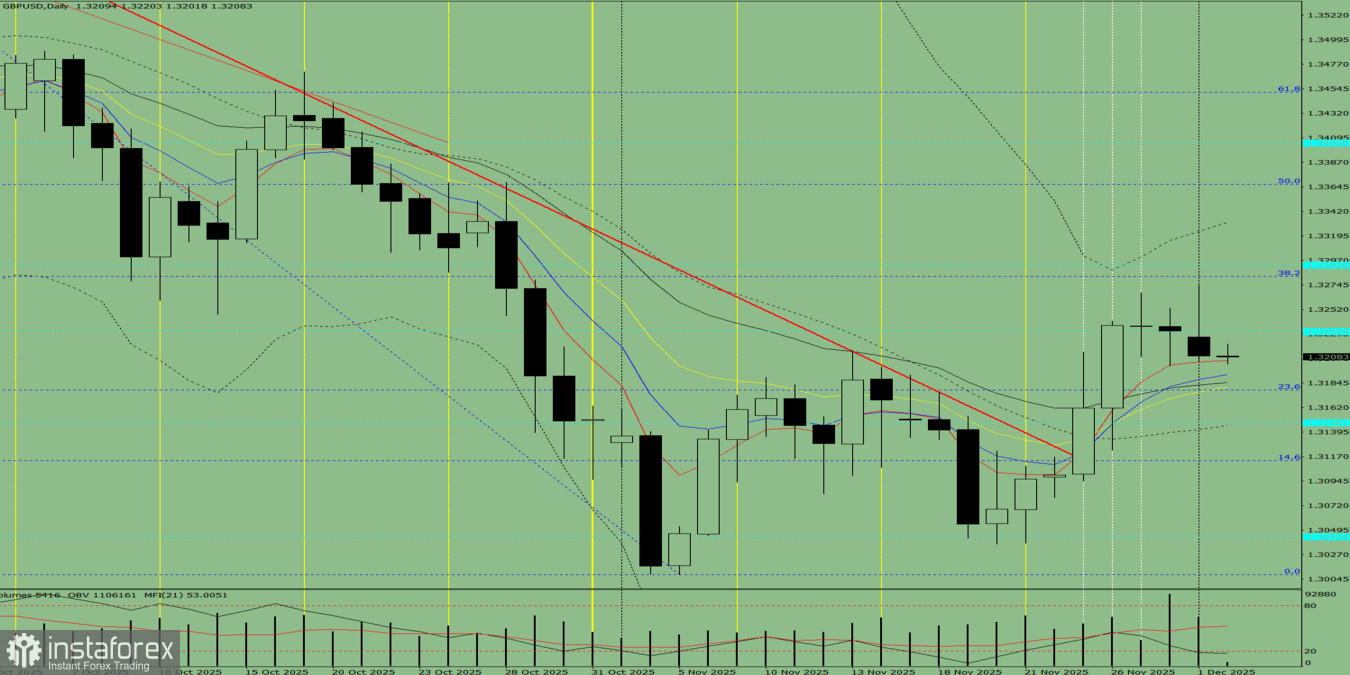
Fig. 1 (daily chart)
Comprehensive Analysis:
- indicator analysis — down
- volume analysis — down
- candlestick analysis — down
- trend analysis — down
- Bollinger Bands — down
- weekly chart — down
Overall conclusion: a downward trend.
Alternative scenario:From the level of 1.3208 (yesterday's daily candle close), the price may continue moving downward toward 1.3178 — the 23.6% retracement level (blue dashed line). Upon testing this level, the price may possibly begin moving upward toward 1.3192 — the 21-period EMA (thin black line).


