


Trade review for Friday:
1H chart of the EUR/USD pair
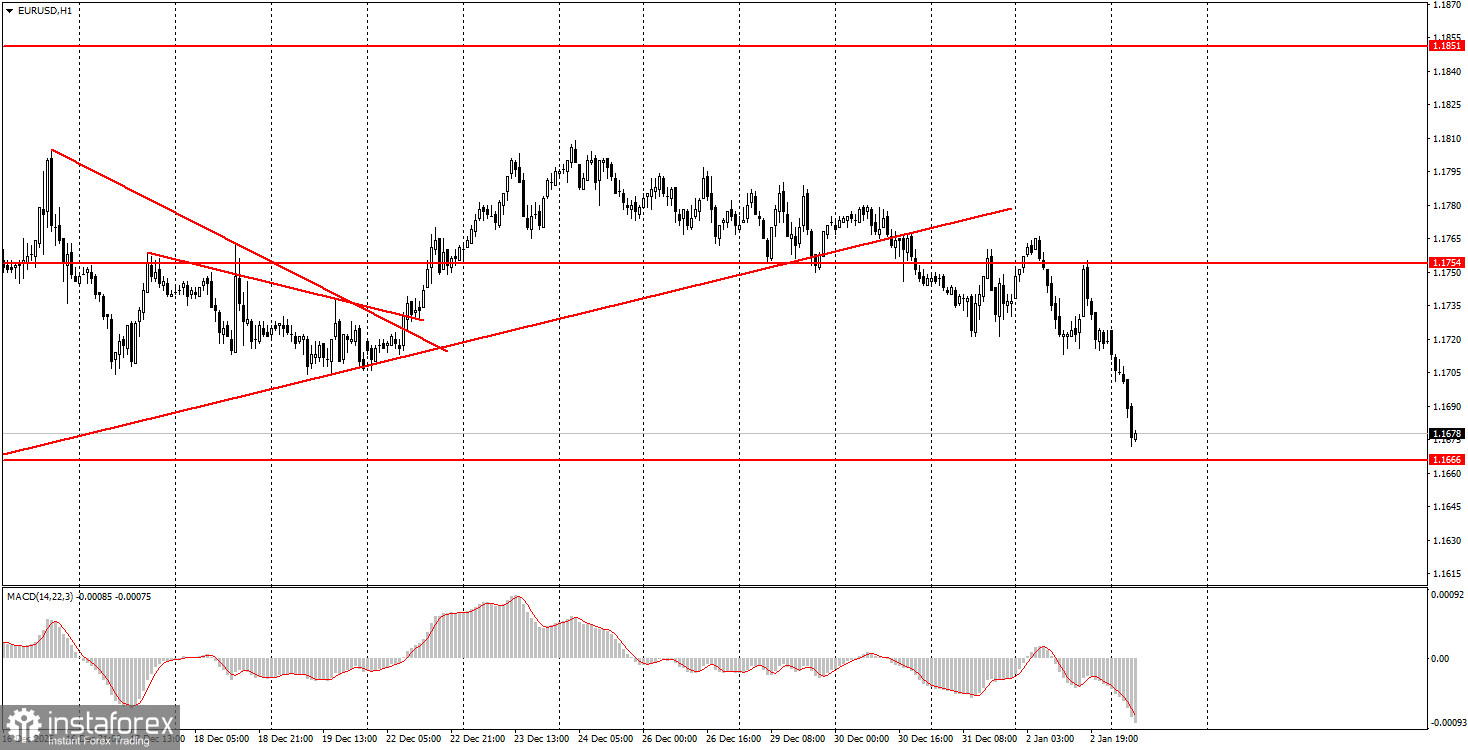
The EUR/USD currency pair traded in mixed directions on Friday, but the day ended with a decline. From a technical point of view, this is natural, since the previously ascending trendline was breached. However, we remind you that over the past two weeks, the pair failed to overcome the 1.1800–1.1830 area, which is the upper boundary of the six-month sideways channel on the daily TF 1.1400–1.1830. We believe this is the actual reason for the pair's recent decline. Over the weekend, another unprecedented event occurred — Donald Trump ordered a military operation in Venezuela, and within a few hours, the U.S. army located and captured Venezuelan President Nicolas Maduro. Now Maduro faces trial in the U.S. for his terrorist and narcotics activities, and Trump is already eyeing Cuba and Greenland. Strangely, traders interpreted this event positively — tonight the U.S. dollar rose. It rose only about 40 pips, which is very little. But the combination of technical and fundamental factors has been supporting the U.S. currency in recent weeks.
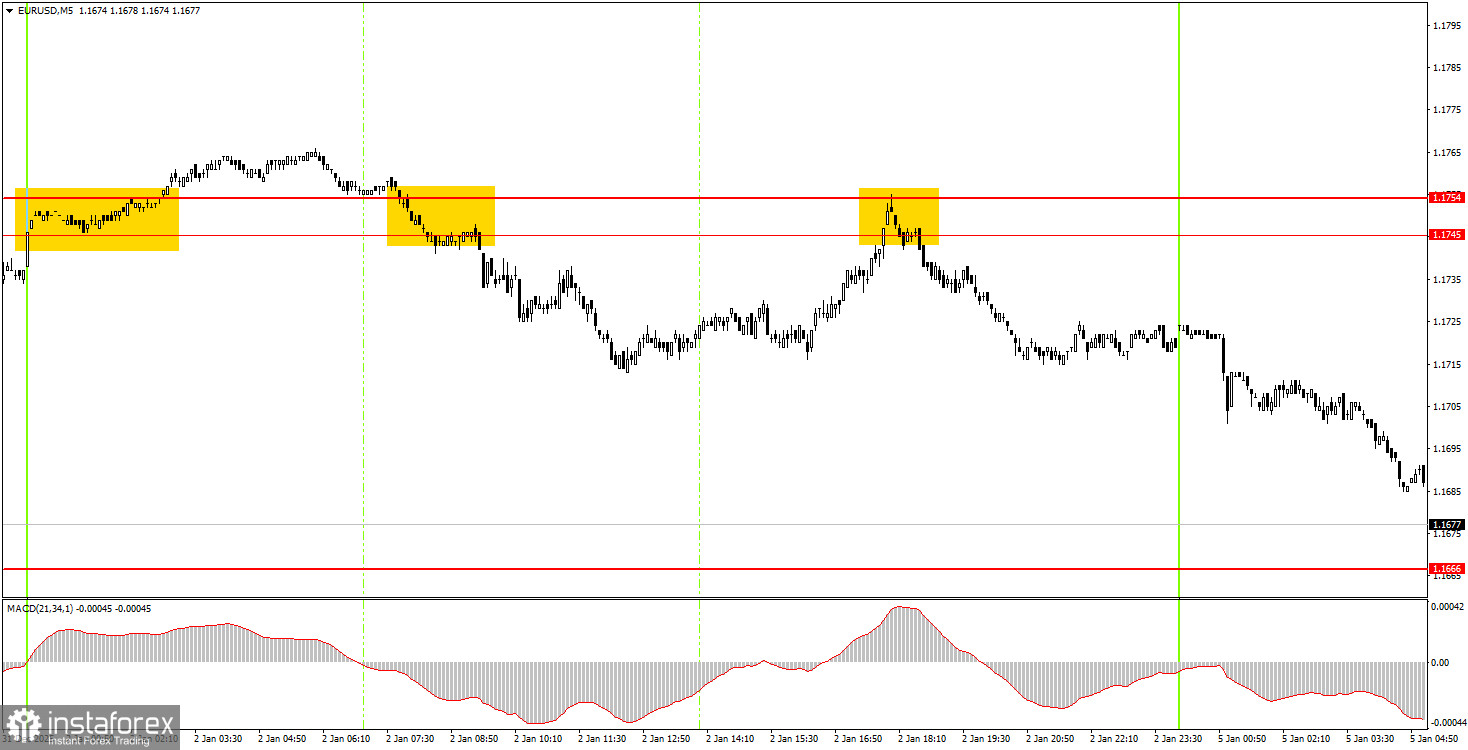
5M chart of the EUR/USD pair
How to trade on Monday:
On the hourly timeframe, the trend has nevertheless changed to bearish. The pair failed to overcome the 1.1800–1.1830 area, which is the upper boundary of the daily TF flat, so the technical decline is logical and may continue down to the 1.1400 level. The overall fundamental and macroeconomic backdrop remains very weak for the U.S. dollar; therefore, we expect the pair to rise in the medium term.
On Monday, beginner traders can trade from the 1.1655–1.1666 area. A rebound from this area will allow opening long positions with a target of 1.1745–1.1755. A close below this area will allow you to remain in short positions with a target of 1.1584–1.1591.
On the 5-minute TF, consider the levels 1.1354–1.1363, 1.1413, 1.1455–1.1474, 1.1527–1.1531, 1.1550, 1.1584–1.1591, 1.1655–1.1666, 1.1745–1.1754, 1.1808, 1.1851, 1.1908, 1.1970–1.1988. No important events or releases are scheduled in the EU for Monday, while the U.S. will publish the important ISM manufacturing index.
Main rules of the trading system:
- Signal strength is assessed by the time required for the signal (rebound or breakout) to form. The less time required, the stronger the signal.
- If two or more trades near a level were opened on false signals, then all subsequent signals from that level should be ignored.
- In a flat market, any pair can generate many false signals or none at all. In any case, at the first signs of a flat, it is better to stop trading.
- Trades are opened during the period between the start of the European session and the middle of the American session, after which all trades must be closed manually.
- On the hourly timeframe, MACD signals should be traded only when there is good volatility and a trend confirmed by a trendline or trend channel.
- If two levels are too close to each other (from 5 to 20 pips), they should be considered as an area of support or resistance.
- After the price moves 15 pips in the correct direction, set the stop loss to breakeven.
What is on the charts:
Support and resistance price levels — levels that serve as targets when opening buys or sells. Take Profit levels can be placed near them.
Red lines — channels or trendlines that display the current tendency and show the preferred trading direction.
MACD indicator (14,22,3) — histogram and signal line — an auxiliary indicator that can also be used as a source of signals.
Important speeches and reports (always included in the news calendar) can significantly affect the movement of the currency pair. Therefore, during their release, one should trade as cautiously as possible or exit the market to avoid a sharp reversal of price against the prior move.
Beginner forex traders should remember that not every trade can be profitable. Developing a clear strategy and sound money management are the keys to long-term success in trading.


