


Well, Bitcoin continues to decline after a sell signal formed on the daily TF, which we had been waiting for about a month. Recall that during the last Bitcoin crash, only one bearish FVG was formed, from which a price reaction was ultimately received. The bullish FVG on the same TF may be invalidated in the near future, providing an indirect confirmation of the sell signal. Thus, the signal is formed; now, the traders' task is to find confirmations and manage the short trade.
On the 4-hour TF, by the way, two confirmations have already been received. First, the last bullish FVG was invalidated, and then a bearish one was formed. A reaction to that bearish FVG could occur today, which would be another sell signal. We remind traders that anything can go off-plan at any moment. Therefore, do not forget about Stop Loss. Bitcoin continues to "look" downward; we expect a serious decline in 2026.
What are Bitcoin's decline targets? If the correction is complete, the minimum medium-term decline target is $70,800. During 2026, we allow for a much larger drop in the world's leading cryptocurrency. As for the macro and fundamental backdrop, all markets are now in a daze. Events in the new year are developing rapidly, and many of them are so contradictory that traders simply ignore them. We cannot conclude that Bitcoin rises or falls because of events related to Jerome Powell or Trump's military aggression toward Latin American countries, Iran, or even Europe.
Overall picture BTC/USD on 1D
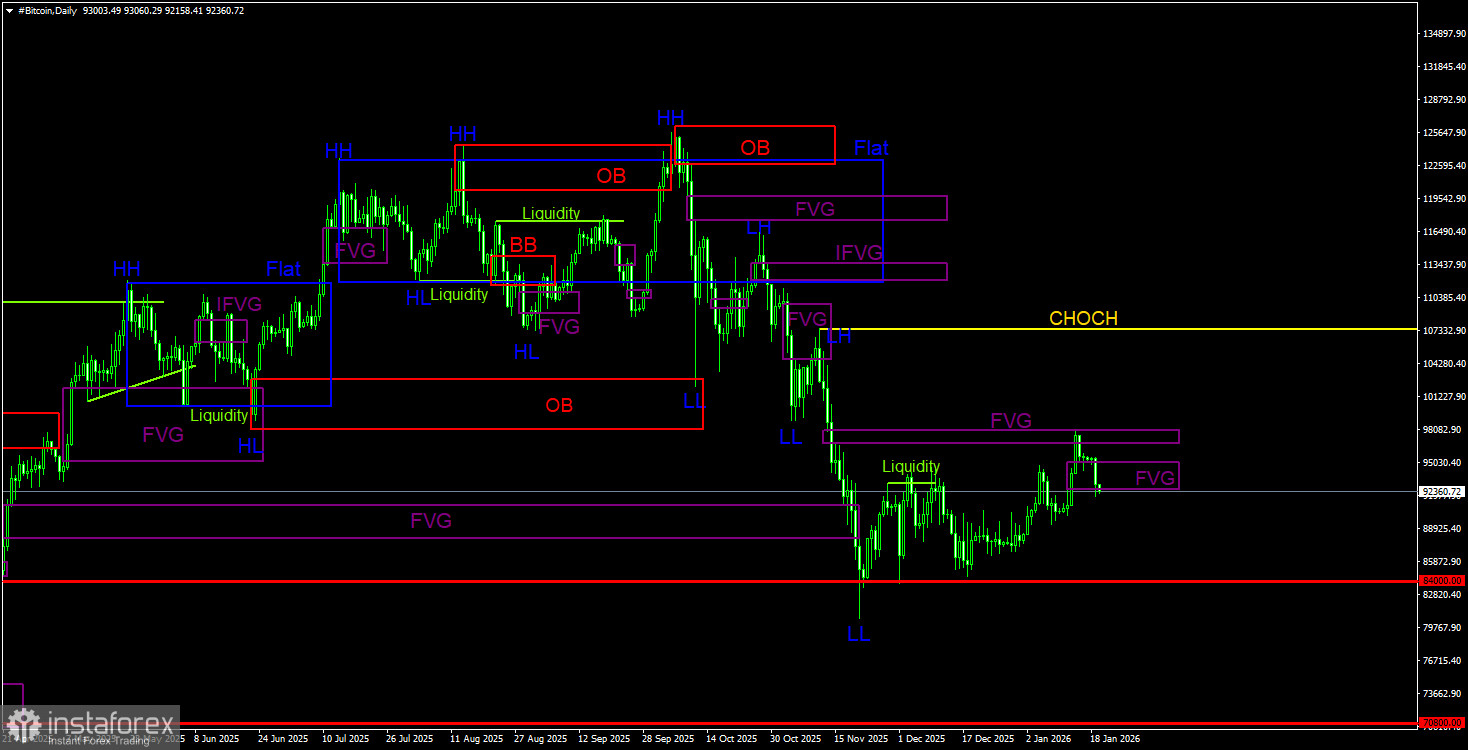
On the daily TF, Bitcoin continues to form a downtrend; the correction is ongoing. The trend structure is identified as downward; the June bullish OB was worked off, the April bullish FVG was overcome, and the $84,000 level (38.2% by Fibonacci), which we highlighted as the first target, was reached. Further, Bitcoin can fall even to $60,000, from where its last ascent began. The only POI area is the bearish FVG, to which a reaction has already been received. A sell trading signal has formed. The target for the new leg down may be $70,800 — the 50.0% Fibonacci level. We are not considering FVG a serious bullish case for now.
Overall picture BTC/USD on 4H
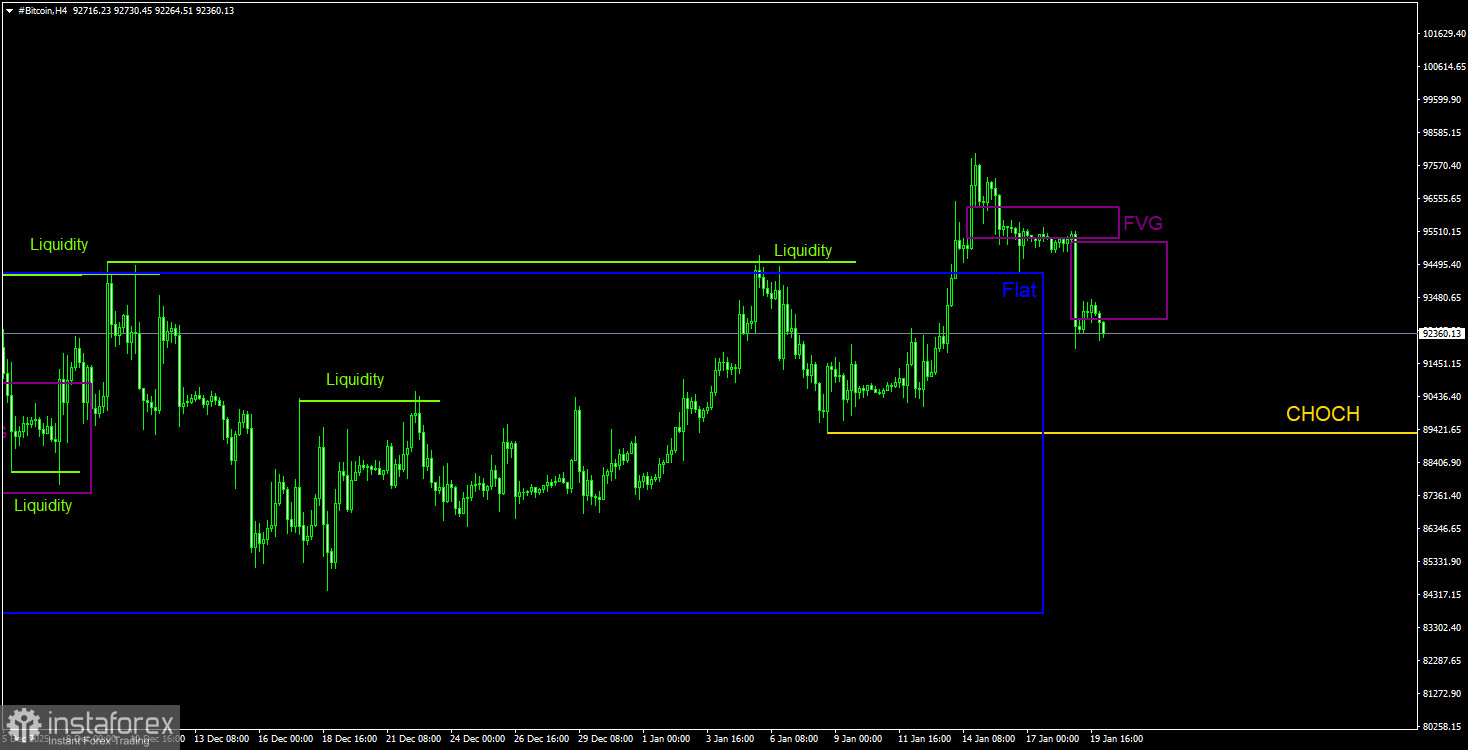
On the 4-hour TF, the price left the sideways channel it had spent 1.5 months in. However, Bitcoin's rise may be short-lived, since the bearish FVG on the daily TF has been worked off. Note that on the 4-hour TF, the structure is now upward, and the CHOCH line lies at $89,300. A break above this line will confirm a resumption of the primary trend. Among bearish patterns, we can note an FVG that formed on Monday, for which a reaction may already follow today.
Recommendations for trading BTC/USD:
Bitcoin continues to form a full-fledged downtrend. The two nearest targets (the bullish OB in the $98,000–$102,700 area and the bullish FVG) have been worked off; now expect a fall to $70,800 (the 50.0% Fibonacci level of the three-year uptrend). Of the POI areas for selling, only the bearish FVG on the daily TF in the $96,800–$98,000 area can be highlighted. This pattern was worked off and received a price reaction. Now the sell trade can be managed while waiting for various confirmations to form on both TFs.
Explanations for illustrations:
CHOCH – change of character / break of trend structure.
Liquidity – liquidity; traders' Stop Loss orders that market makers use to accumulate their positions.
FVG – Fair Value Gap / area of price inefficiency. Price moves very quickly through such areas, indicating a complete absence of one side of the market. Subsequently, the price tends to return and receive a reaction from such areas.
IFVG – Inverted Fair Value Gap. After returning to such an area, the price does not receive a reaction but impulsively breaks through it and then tests it from the other side.
OB – Order Block. The candle on which a market maker opened a position to take liquidity and form their own position in the opposite direction.


