


Bitcoin continues to pull the entire cryptocurrency market down with it, rather than up. Recall that a sell signal formed on the daily timeframe (in parallel with the weekly TF) that we had been waiting for for about a month. Since the fundamental backdrop is not currently a driver of Bitcoin, we focus on technical factors. Among the technical factors, none point to Bitcoin rising in the near term.
Meanwhile, Justin Bons, head of the investment firm Cyber Capital, stated in an analytical piece on mining economics and security that Bitcoin could collapse in the next decade. According to Bons, the security model of the Bitcoin network is fundamentally unviable given the economics of halvings and mining. The expert believes that funds for Bitcoin's security are steadily decreasing due to miners' declining profits. After each halving, their mining revenue is cut in half, and spending on security falls accordingly. To keep security spending at the same level, miners' revenues would have to grow proportionally — that is, double every four years over the next 100 years, until the last bitcoin is mined.
However, Bons considers such a scenario unrealistic. At some point, the cost of a cyberattack on the network will become economically feasible, and computing power by then will allow attacks to be carried out regularly. Sooner or later, society will face a choice: either abandon the 21 million coin limit and introduce Bitcoin inflation, or accept attacks on the network. Bons also noted that Bitcoin's throughput is extremely low—only 7 transactions per second. If panic begins in the market and investors rush to sell Bitcoin en masse, the confirmation queue could stretch to two months, which would spark a new wave of panic, since investors would simply not be able to convert their bitcoins into anything else.
Recommendations for trading BTC/USD:
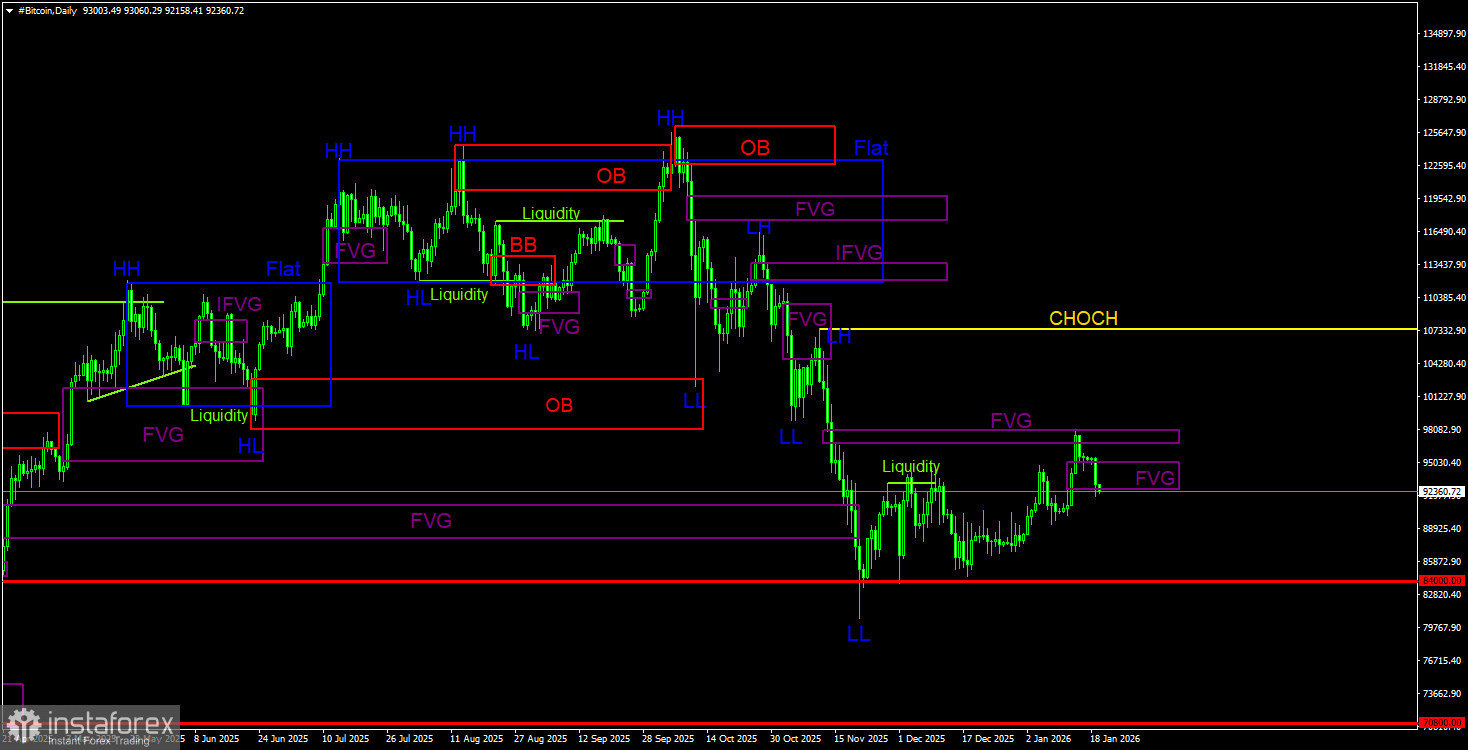
Bitcoin continues to form a full-fledged downtrend. The two nearest targets (the bullish OB in the $98,000–$102,700 area and the bullish FVG) have been worked off; now expect a fall to $70,800 (the 50.0% Fibonacci level of the three-year uptrend). Of the POI areas for selling, only the bearish FVG on the daily TF in the $96,800–$98,000 area can be highlighted. This pattern was worked off and received a price reaction. Now the sell trade can be managed while awaiting various confirmations to form on both timeframes.
Recommendations for trading ETH/USD:
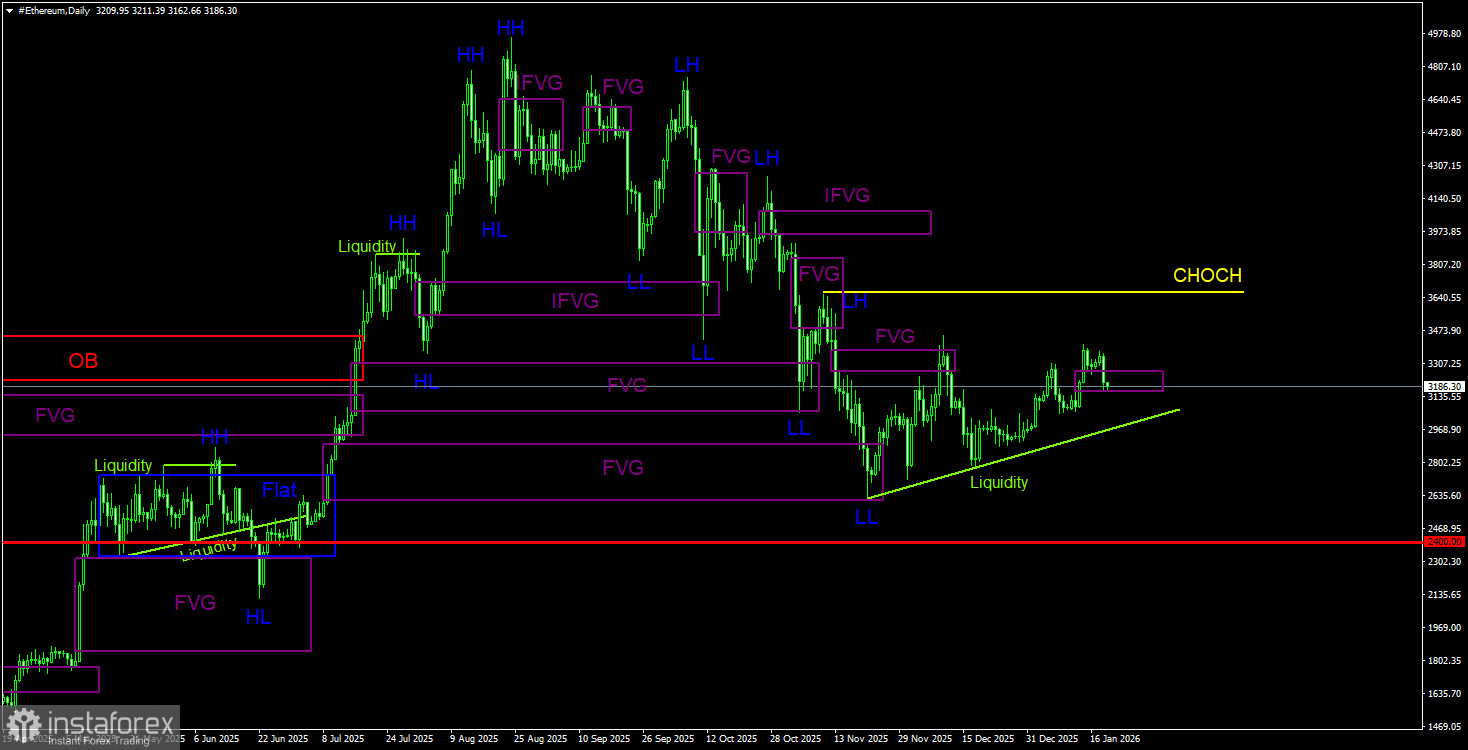
On the daily TF, a downtrend continues to form. The key sell pattern was and remains the bearish order block on the weekly TF. The move provoked by this signal should be strong and long-lasting. The correction in the crypto market may be complete. On the daily TF, there are no clear POI areas for selling Ether. On the 4-hour TF, a bearish FVG has formed, identical to the FVG present for Bitcoin. Thus, this FVG serves as the only sales POI area. Decline targets of $2,717 and $2,618 remain relevant — and these are just the nearest targets. Ether's long-term downside potential is much greater.
Note the liquidity pool on the daily chart in the form of a trendline. Below that line are stop losses and pending sell orders. Those orders constitute liquidity for market makers. We are almost certain that Ether will show a drop below the trendline.
Explanations for illustrations:
CHOCH – change of character / break of trend structure.
Liquidity – liquidity; traders' Stop Loss orders that market makers use to accumulate their positions.
FVG – Fair Value Gap / area of price inefficiency. Price moves very quickly through such areas, indicating a complete absence of one side of the market. Subsequently, the price tends to return and receive a reaction from such areas.
IFVG – Inverted Fair Value Gap. After returning to such an area, the price does not receive a reaction but impulsively breaks through it and then tests it from the other side.
OB – Order Block. The candle on which a market maker opened a position to take liquidity and form their own position in the opposite direction.


