


Trump's lifeline is working! Iran's willingness to threaten any ship transiting the Strait of Hormuz, the market's repricing of how long a US-Iran military conflict could last, and stagflation fears sent the S&P 500 down toward lows not seen since November. Yet, as soon as the White House signalled the US would ensure energy flows worldwide by providing military protection for tankers, the broad index recovered most of its losses.
Performance of US stock indices
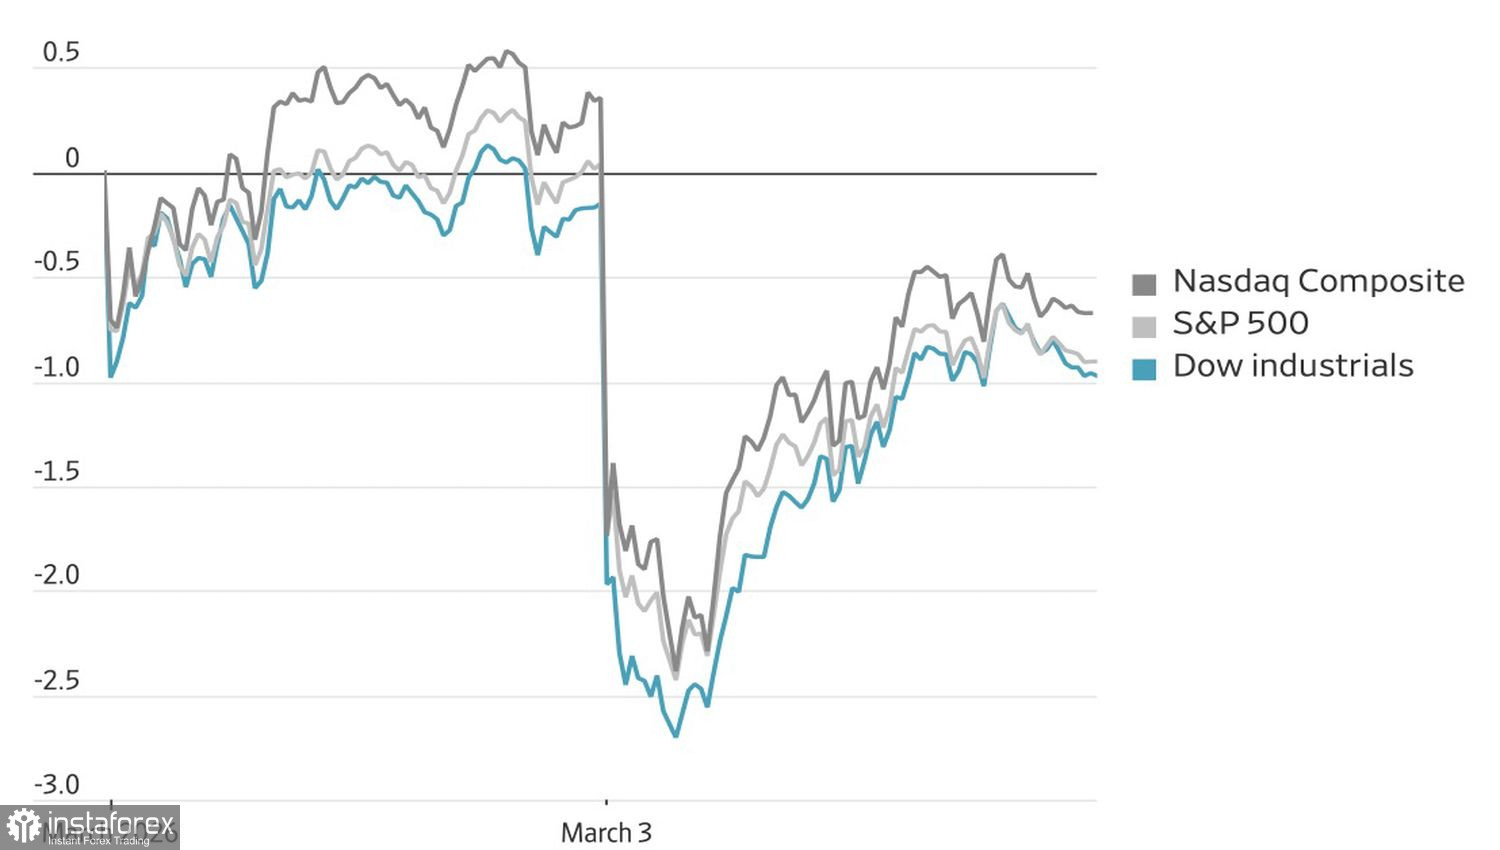
These days, the last often become the first and leaders turn into laggards, so the rout in the Dow Jones and Russell 2000 surprised no one. At the start of spring, investors bought the dips, convinced that the Middle East flare-up would be short-lived. A day later, it became clear that military action could last four to five weeks, perhaps longer. That prospect hit the economy and prompted a sell-off in small-cap names that are most sensitive to economic conditions.
At first sight, the United States should benefit from higher oil prices as a net energy exporter. But energy accounts for only about 3.5% of the S&P 500's market cap. Most US companies remain net buyers of oil and related products. And a rally in Brent and WTI is likely to stoke inflation, forcing the Fed to keep the funds rate higher for longer.
Yes, the current oil rally is not on the scale of 2022, but rates are higher now than in the post-pandemic period. Which is worse for the US economy is unclear, and it is unsurprising that economically sensitive issuers were swept up in the sell-off. Goldman Sachs even warns that AI could displace roughly 11 million workers — about 6% of the labor force — and notes that companies discussing AI cut job openings by 12% in 2025 versus an 8% average for all firms.
S&P 500 and Wall Street consensus dynamics
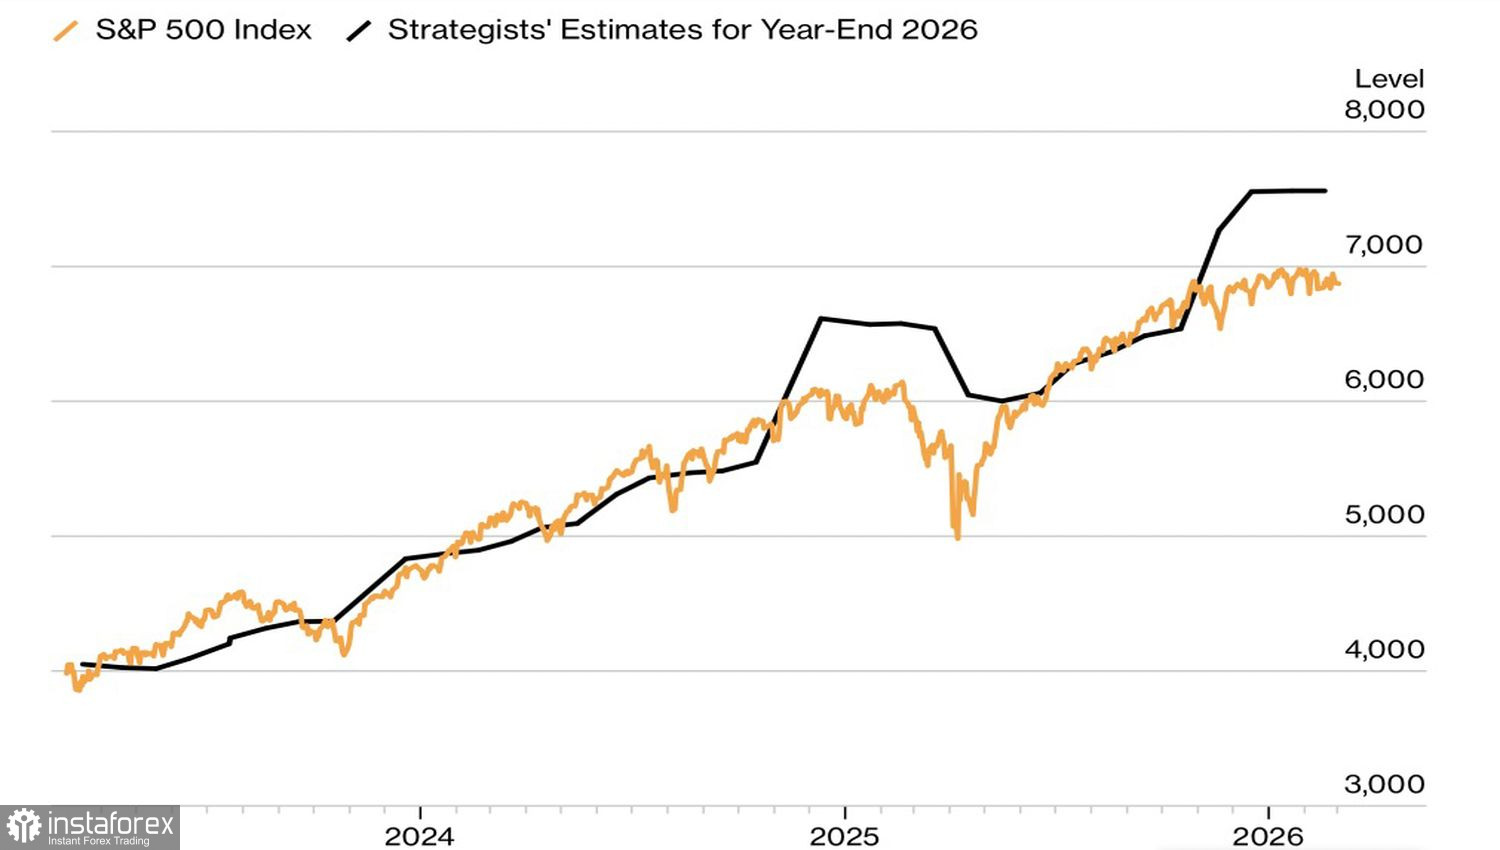
Despite all the negatives, Wall Street strategists are not rushing to change their S&P 500 forecasts. After flat performance year-to-date, they still expect a 10% rally in the broad index by year-end. Are they seriously betting that the market will sail through the storm in the Middle East? Ultimately, it will hinge on how long the conflict lasts.
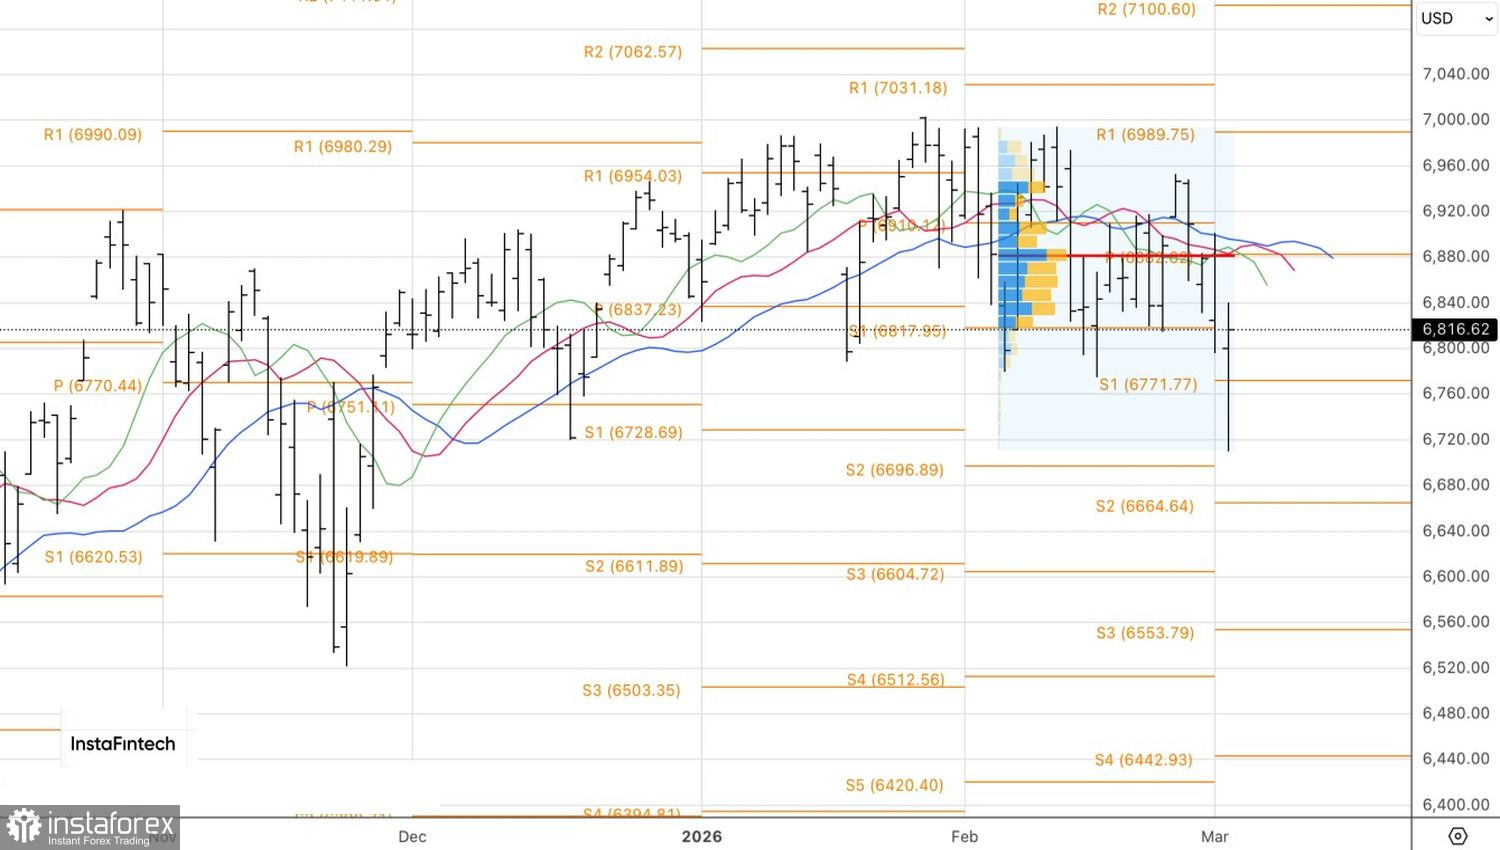
Technically, the S&P 500 shows a pin bar with a long lower shadow on the daily chart. That signals bear weakness and provides a rationale for a buy-stop order on a breakout at a high, that is, building long positions in the broad index at 6,840. Conversely, failure to hold within the 6,800–7,000 consolidation range and a close below its lower boundary would be a reason to sell.


