


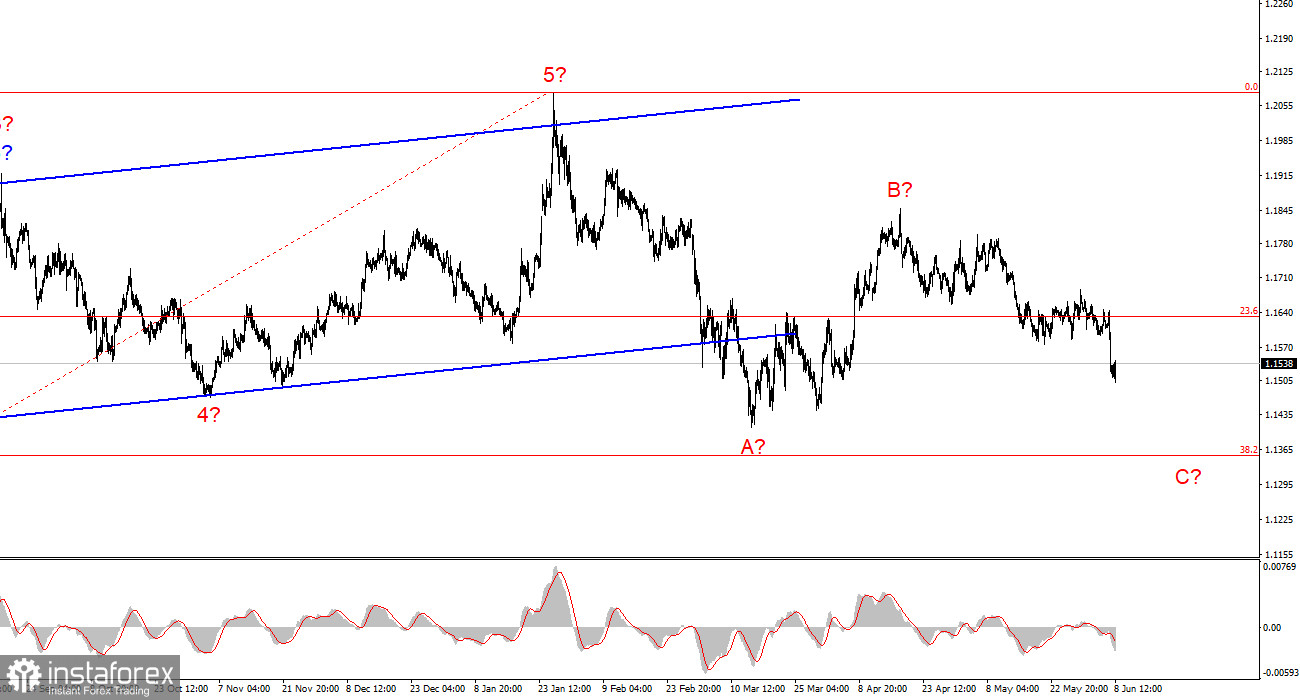
The wave pattern on the 4-hour chart of EUR/USD has undergone some modifications. The cancellation of the bullish trend segment (lower chart), which originated in January of last year, is still not under consideration. However, the trend structure has now taken on a corrective form. From a long-term perspective, wave C can be expected to develop, with its low likely to be below the low of wave A. At the moment, it is difficult to believe in such a strong decline in the euro, but the first quarter of 2026 demonstrated that geopolitics can dramatically alter market trends.
On the lower time frame, I can identify a classic three-wave bullish corrective structure. Following its completion, a new downward trend segment began to form, which, logically, should be impulsive in nature. If this assumption is correct, we should expect a five-wave structure within wave C of the higher degree, targeting levels below the 1.1400 level. Are there fundamental reasons to expect such a strong appreciation of the US dollar? Not definitive ones, but the market is gradually losing confidence in a deal between the United States and Iran, which is supporting sellers.
The EUR/USD pair changed very little during Monday's session, and price fluctuations remained limited. This is neither surprising nor unusual, as there were no economic releases or major events scheduled today, while the market is increasingly paying less attention to geopolitical headlines.
Today, Iran and Israel exchanged new missile strikes, the first such attacks since the temporary ceasefire was established. Therefore, in my view, both sides continue to move steadily toward further escalation of the conflict or, at the very least, a prolonged and exhausting confrontation—not toward a peace agreement. As a result, the U.S. dollar remains the preferred currency among market participants, while today's minor decline in the dollar should be viewed as nothing more than a correction following Friday's rally.
However, it is also possible that the dollar's advance has already ended, as EUR/USD has completed a five-wave decline. Naturally, the downward trend segment could become more extended and complex if geopolitical developments continue to signal a lack of progress toward resolving the Middle East conflict. Nevertheless, from a wave-analysis perspective, the five-wave structure appears complete. Therefore, at least three corrective waves to the upside can be expected.
Meanwhile, Donald Trump continues to insist that a deal with Iran could be reached in the near future and has even asked Israeli Prime Minister Benjamin Netanyahu not to launch retaliatory strikes against Iran. Notice how the U.S. president's rhetoric has changed: from "we will destroy Iran" to "please do not strike Iran; we need a deal."
The White House leader clearly understands that the longer the conflict lasts, the lower his chances of maintaining full political control in the United States. Elections are only five months away, while Trump's approval ratings—and, consequently, those of the Republican Party—continue to deteriorate. Trump urgently needs to bring the conflict to an end, declare victory, and sign a nuclear agreement. It increasingly appears that Washington may have to make the key concessions during the negotiations.
General Conclusions
Based on my EUR/USD analysis, I conclude that the instrument remains within a bullish trend segment (lower chart), while in the shorter term it remains within a downward trend segment that may already be complete.
In my opinion, the current environment offers a reasonable opportunity to consider long positions. A failed attempt to break below the 1.1513 level, which corresponds to the 76.4% Fibonacci retracement, combined with the apparent completion of the downward trend segment, suggests that the instrument may begin forming a new bullish wave sequence targeting the 1.1700 level and above.
On the higher time frame, a bullish trend segment remains visible, followed by the development of a corrective wave structure. In the near future, wave C is expected to form with targets near 1.1352, which corresponds to the 38.2% Fibonacci retracement level. Once the A-B-C structure is completed, a new long-term bullish trend may begin.
Key Principles of My Analysis
- Wave structures should be simple and easy to interpret. Complex structures are difficult to trade and frequently undergo revisions.
- If there is no confidence in the market situation, it is better to stay out of the market.
- There can never be absolute certainty regarding market direction. Always use protective Stop Loss orders.
- Wave analysis can be combined with other analytical methods and trading strategies.


