


GBP/USD is challenging the resistance level of 1.2561 and it's looking to break above that zone that strengthens the bias towards 1.2645. The bollinger band is getting a contraction around the 1.2550 level and that should be a sign for a possible strong move to come further. If the pair pullbacks and break the 1.2475 level, then it can plunge toward 1.2414.
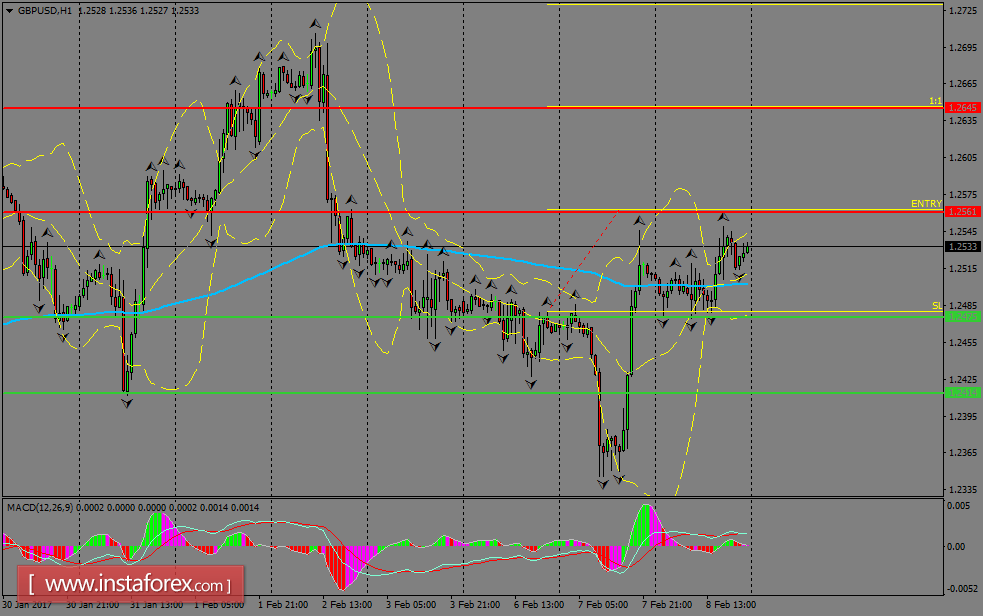
H1 chart's resistance levels: 1.2561 / 1.2645
H1 chart's support levels: 1.2475 / 1.2414
Trading recommendations for today: Based on the H1 chart, buy (long) orders only if the GBP/USD pair breaks a bullish candlestick; the resistance level is at 1.2561, take profit is at 1.2645 and stop loss is at 1.2480.


