


USDX continues to move around the 100.00 handle and it remains steady above the 200 SMA at H1 chart. Next key resistance is located at the 101.43 level, where a breakout should open the doors to test the 102.39, while a break below the 100.00 zone should strengthen the bearish bias for the mid-term and eventually, the index could test the 98.98 level.
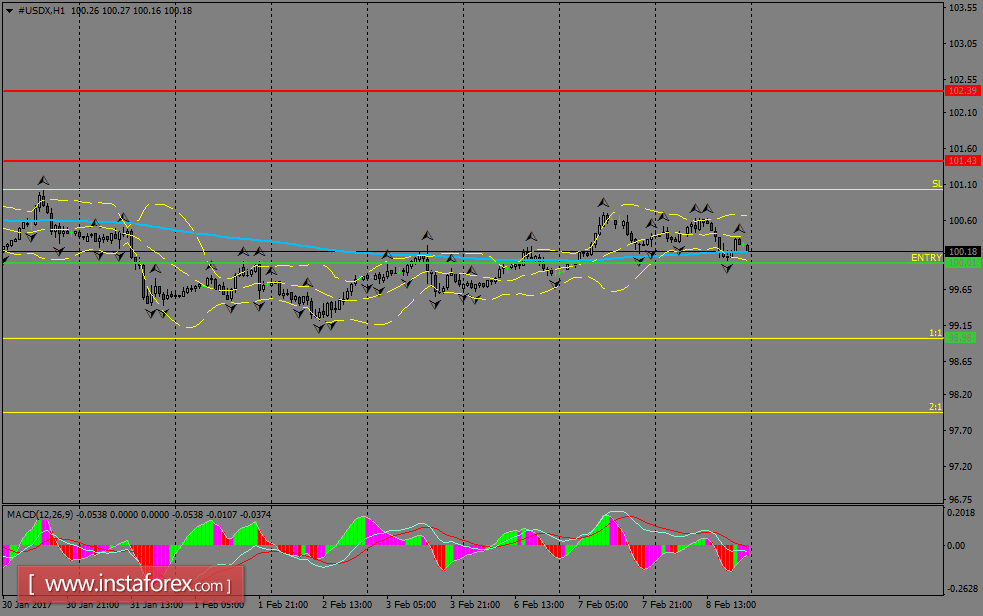
H1 chart's resistance levels: 101.43 / 102.38
H1 chart's support levels: 100.01 / 98.98
Trading recommendations for today: Based on the H1 chart, place sell (short) orders only if the USD Index breaks with a bearish candlestick; the support level is at 100.01, take profit is at 98.98 and stop loss is at 101.03.


