


Gold price tested short-term support yesterday at $1,220 and еру price bounced off that level confirming support. Trend remains bullish in the medium term and in the long term I remain bullish expecting a new big upward move towards $1,280-$1,320 to start soon.
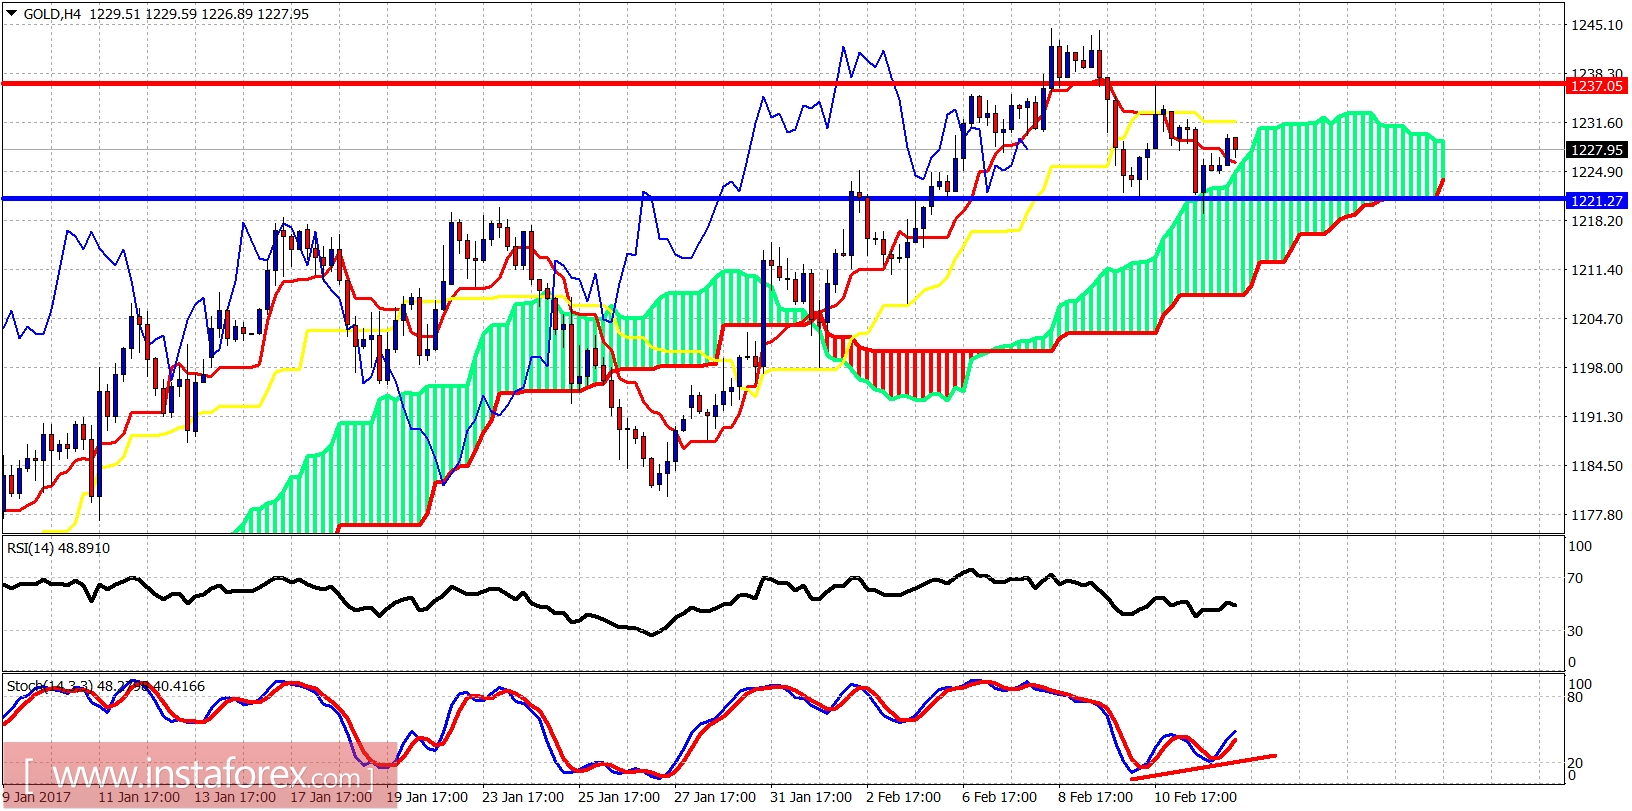
Blue line - support
The Stochastic oscillator is diverging. The price has found support at the blue horizontal line and at the 4-hour Ichimoku cloud. Short-term support remains at $1,220 and resistance is at $1,237-39. Next upside target is at $1,280-$1,320. Only a break below $1,160 could put my bullish scenario in danger.
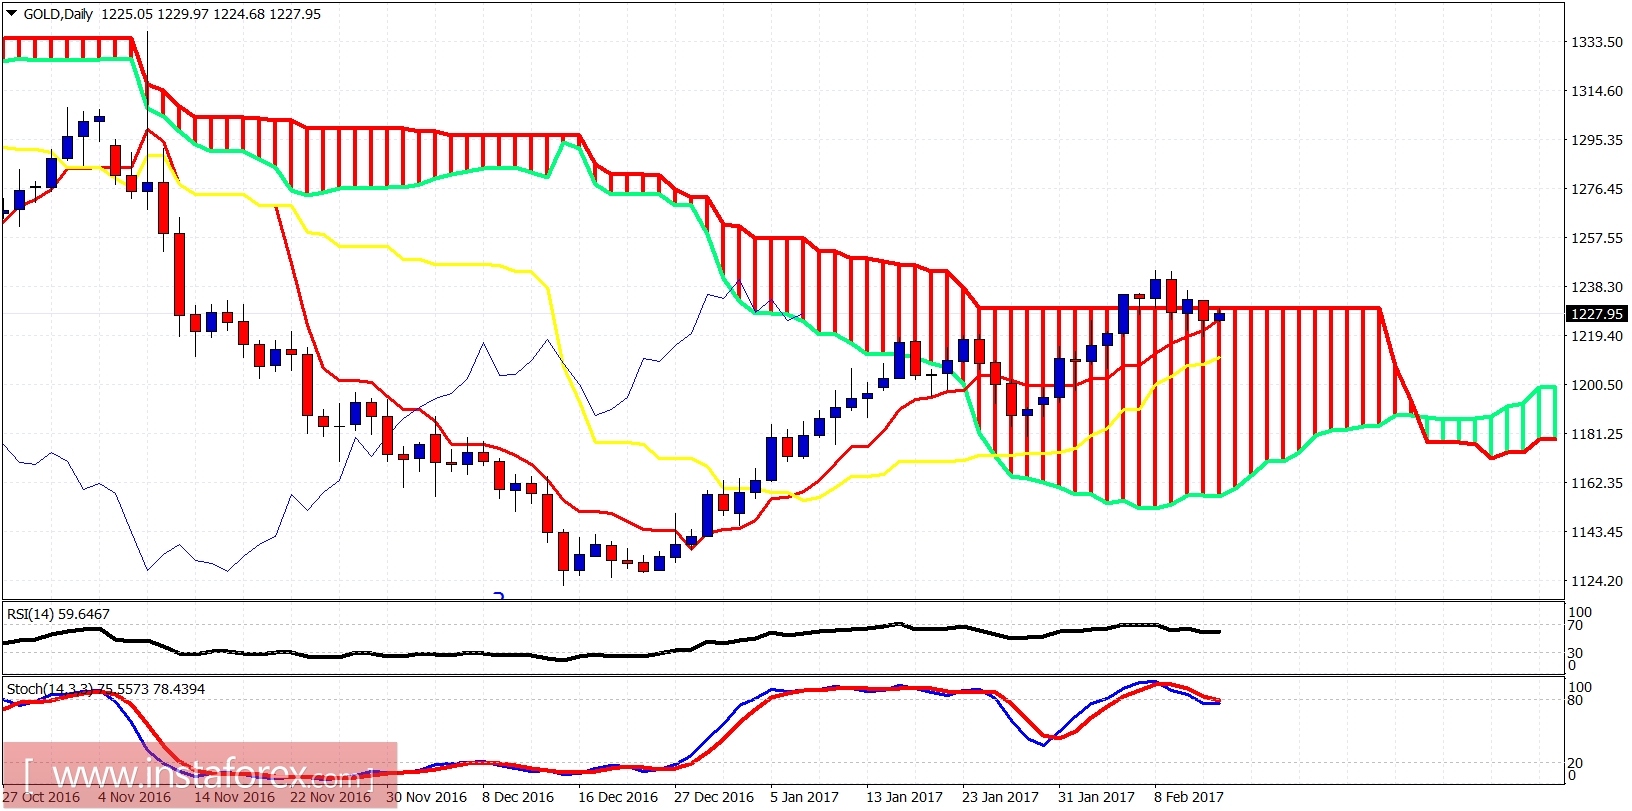
Gold price is testing daily tenkan-sen (red line indicator) support. The price managed to break above the cloud but has entered back inside. Next daily support is at the kijun-sen (yellow line indicator) at $1,210-12. I do not expect this support to be broken. A break above $1,245 will confirm my bullish scenario and Gold will push higher towards $1,280-$1,320.


