


The Dollar index is trading around resistance level of 101. The price remains inside the bearish channel although it managed to break briefly above it. The price is trading above the Ichimoku cloud in the 4-hour chart. This is a bullish sign. The pullback will be very important.
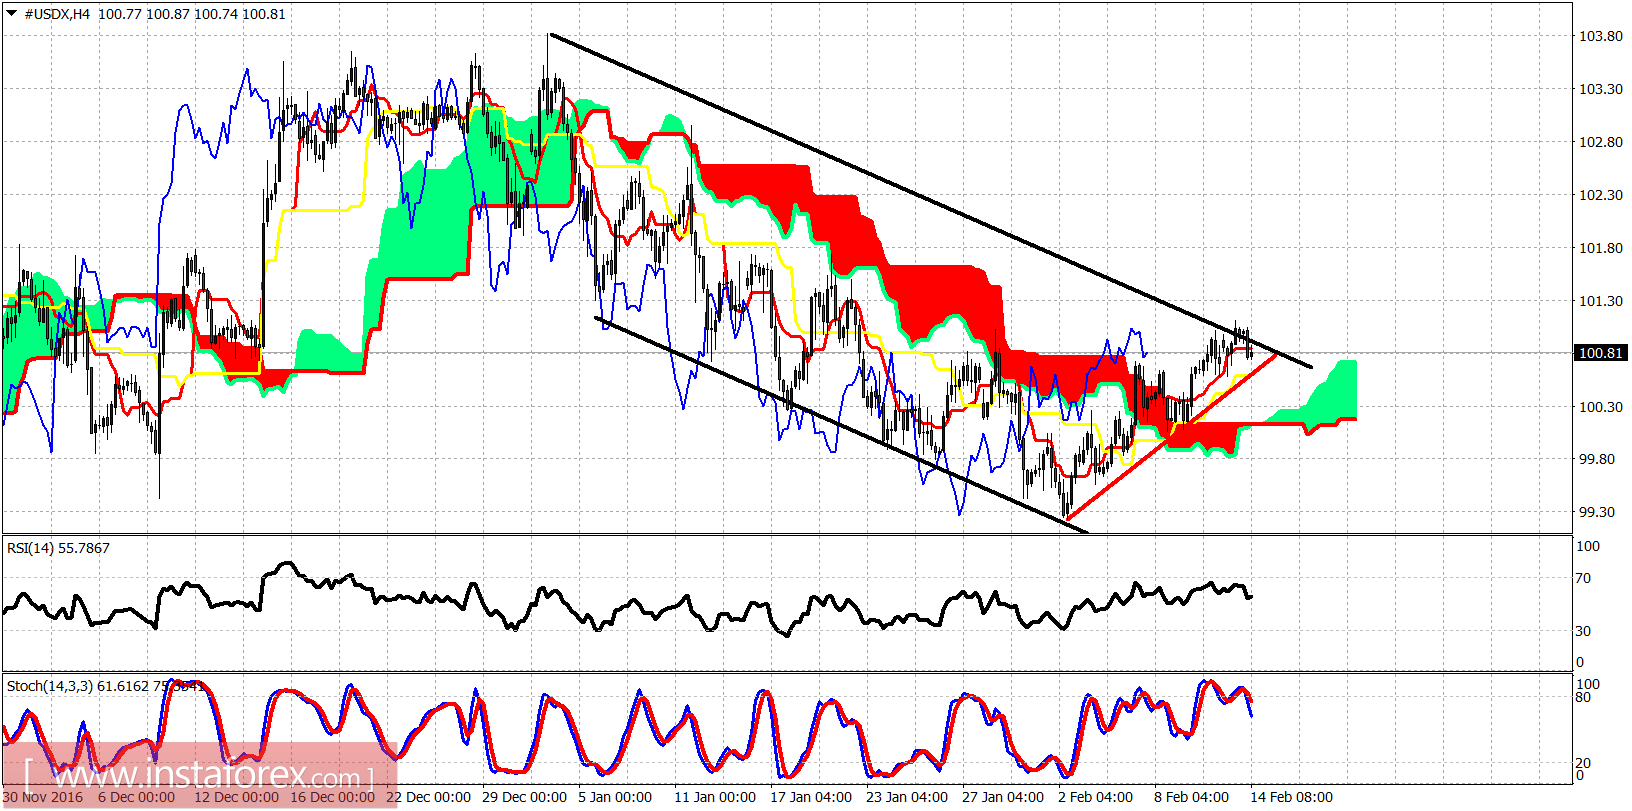
Red lines - support
Short-term support is at 100.50. Cloud support is at 100.15. The bulls must hold this level. A break below 100.15 will be a bearish sign and will most probably push the index towards 99-98.50. Resistance is at 101. The price is making higher highs and higher lows. Short-term trend has changed to bullish. The low could already be in and the pullback that I expect has high importance to the medium-term trend.
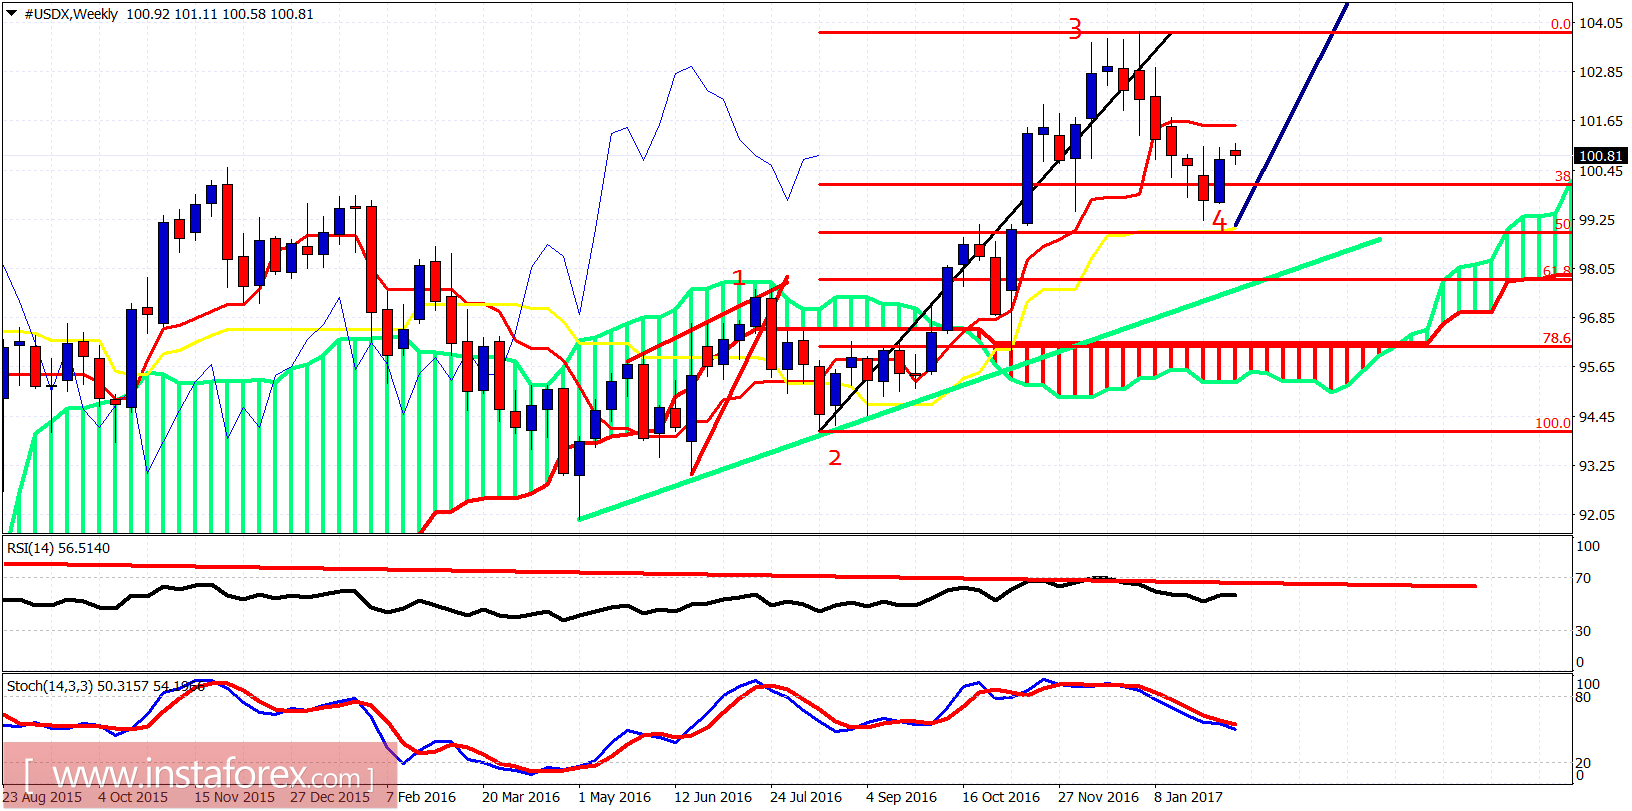
In the weekly chart above, you see the price still between the tenkan- and kijun-sen indicators (red and yellow lines). Wave low could very well be in, but a break above 101.70 is required for this scenario to have more chances. There is also a bearish scenario where we currently make a right hand shoulder with the neckline at 99 and a target towards 95-96 if the neckline breaks. Traders need to be very cautious as neither bullish nor bearish scenario is clearly depicted yet.


