


Gold price remains supported. Despite the push lower yesterday towards $1,230, Gold buyers stepped in and pushed price back above $1,237. Trend remains bullish. Soon we should see a break out above $1,245 and a move towards $1,280-$1,320.
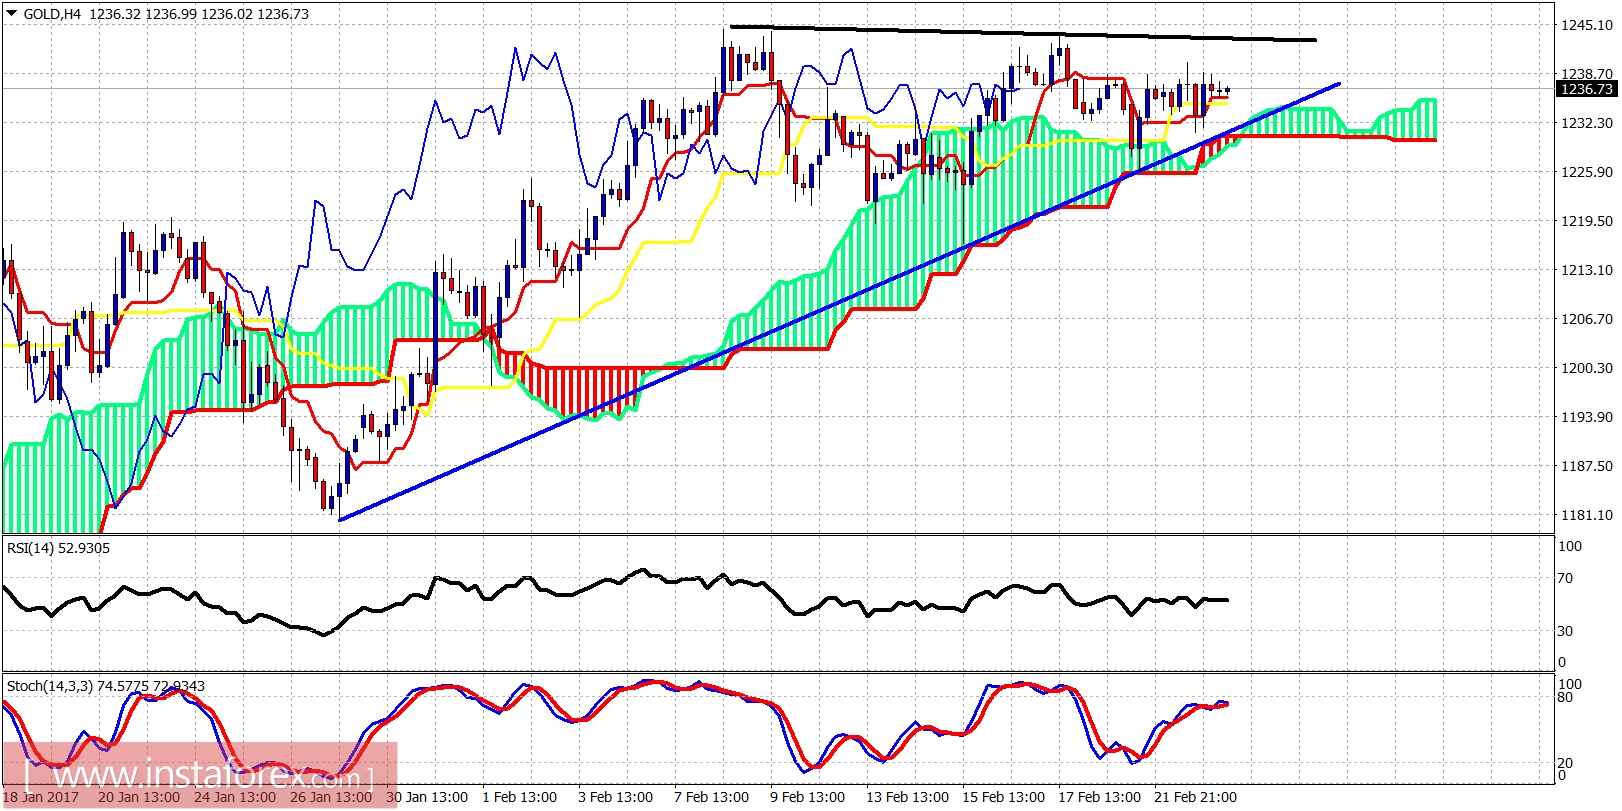
Blue line - support
Black line - resistance
Gold price continues to trade above the Ichimoku cloud. Price also reamains above important support trend line. Every time price made a dip towards $1,220 or below $1,230, buyers stepped in and pushed Gold higher above $1,235 each time. However, the confirmation of the bullish trend will come with the break above $1,245. Breaking it will be a good bullish signal.
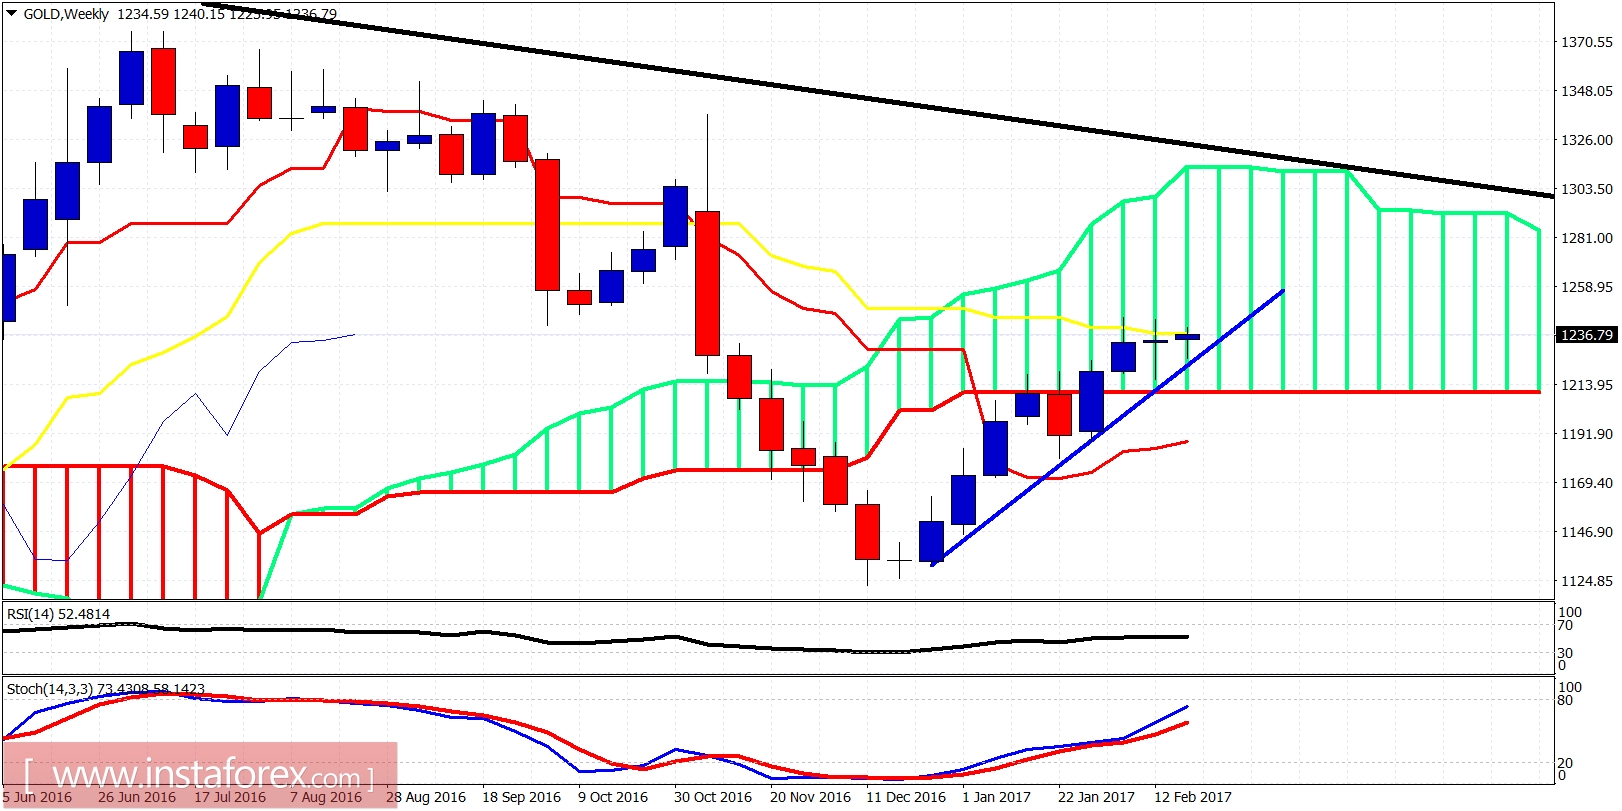
Why is Gold price stuck here at $1,240-45? Because here we find the weekly kijun-sen (yellow line indicator) resistance. It is not easy to break it. But if and when it breaks upwards, we will be heading towards the upper cloud boundary around $1,280-$1,300.


