Main Quotes Calendar Forum
flag

FX.co ★ Technical analysis of USDX for February 23, 2017

parent
Forex Analysis:::2017-02-23T08:00:36

Technical analysis of USDX for February 23, 2017

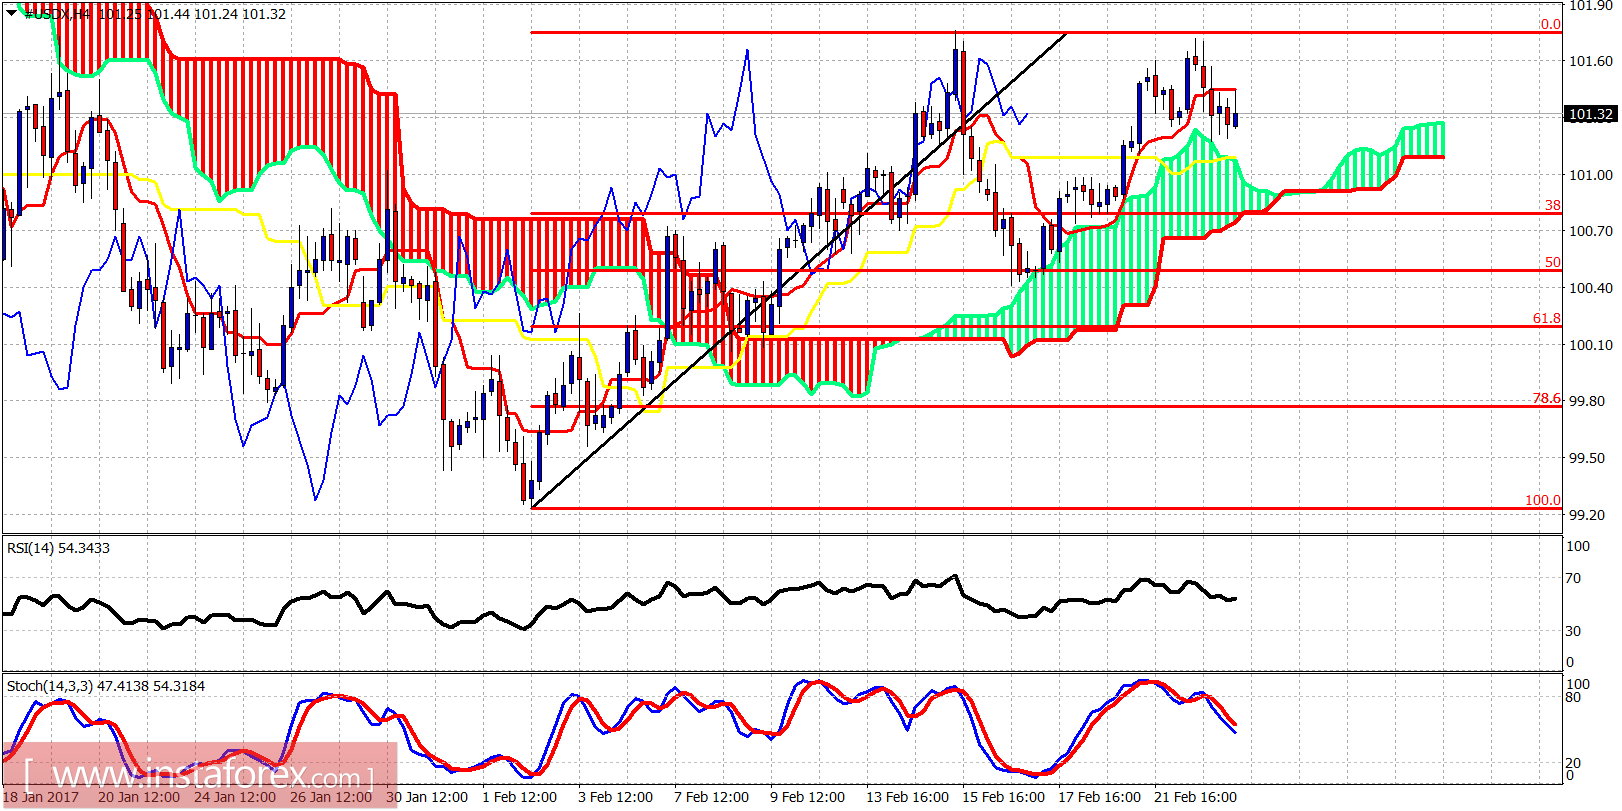
The Dollar index reached important resistance yesterday at 101.70 but got rejected and pulled back towards 101.40 short-term support. The bearish scenario of the Head-and-Shoulders pattern is still applicable but only a break below 99.25 will confirm it.

Technical analysis of USDX for February 23, 2017

Trend is bullish. The Dollar index continues to trade above the Ichimoku cloud on the 4-hour chart. Short-term resistance is at 101.70 and support at 101.30-101.40. Next support is at 100.80. There is a danger of a double top rejection and reversal and that is why the risk reward for short positions is good at current levels, especially if we take under consideration the Head-and-Shoulders pattern that is being formed.

Technical analysis of USDX for February 23, 2017

Black line - neckline

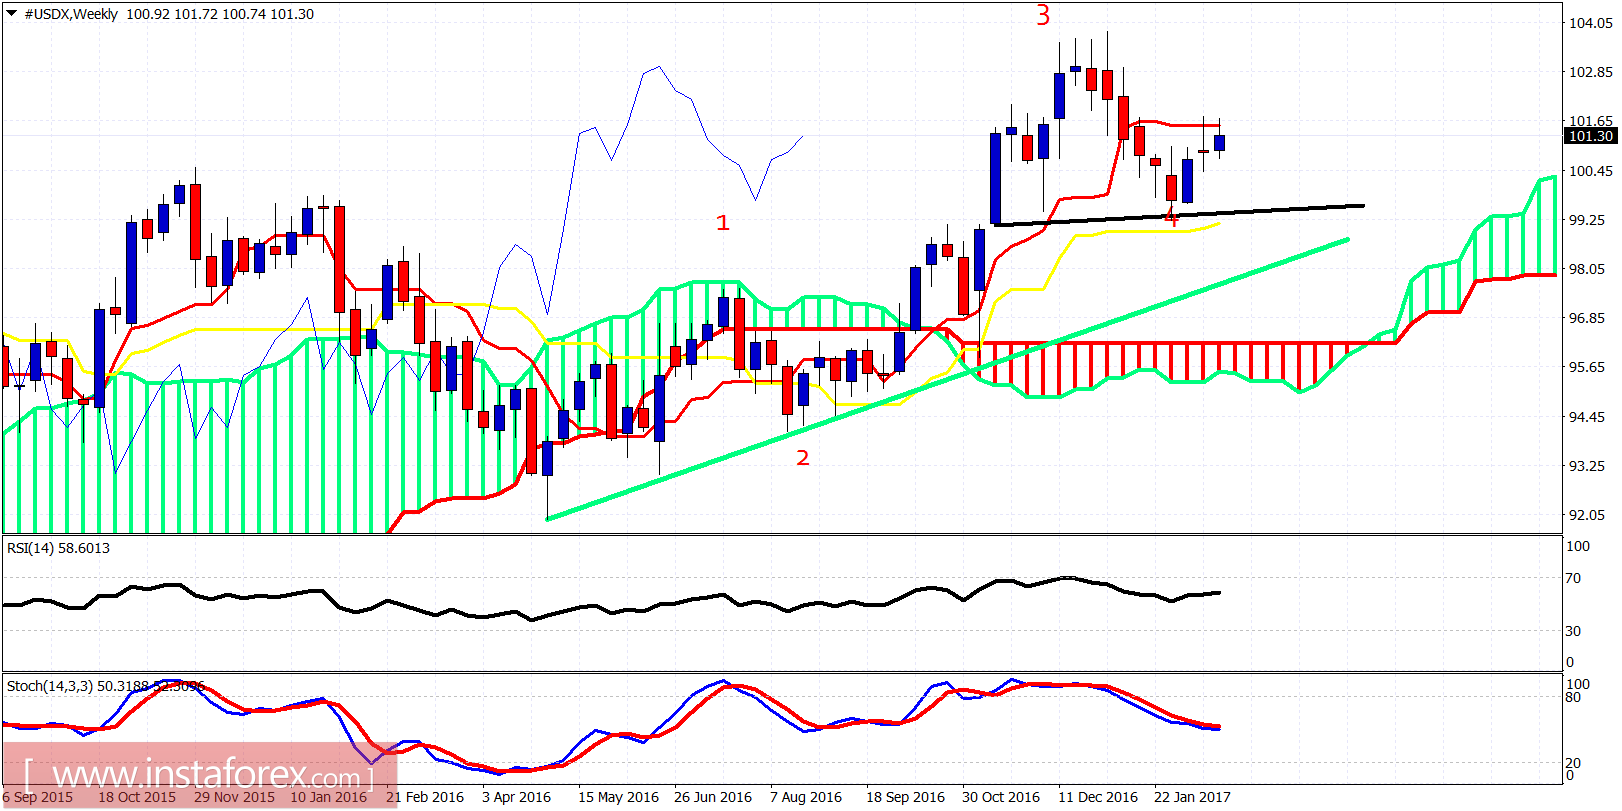
Green line - long-term trend line support

The Dollar index is trading between the kijun- and tenkan-sen indicators (yellow and red line indicators). On a weekly basis, trend remains bullish but a possible double top at 101.80 and rejection by the tenkan-sen will be bad news for bulls. Don't forget that we could be forming the right hand shoulder in the bearish Head-and-Shoulders pattern.

Analyst InstaForex
Share this article:
parent
loader...
all-was_read__icon
You have watched all the best publications
presently.
We are already looking for something interesting for you...
all-was_read__star
Recently published:
loader...
More recent publications...