Main Quotes Calendar Forum
flag

FX.co ★ Wave analysis of gold for March 22, 2017

parent
Forex Analysis:::2017-03-22T07:56:26

Wave analysis of gold for March 22, 2017

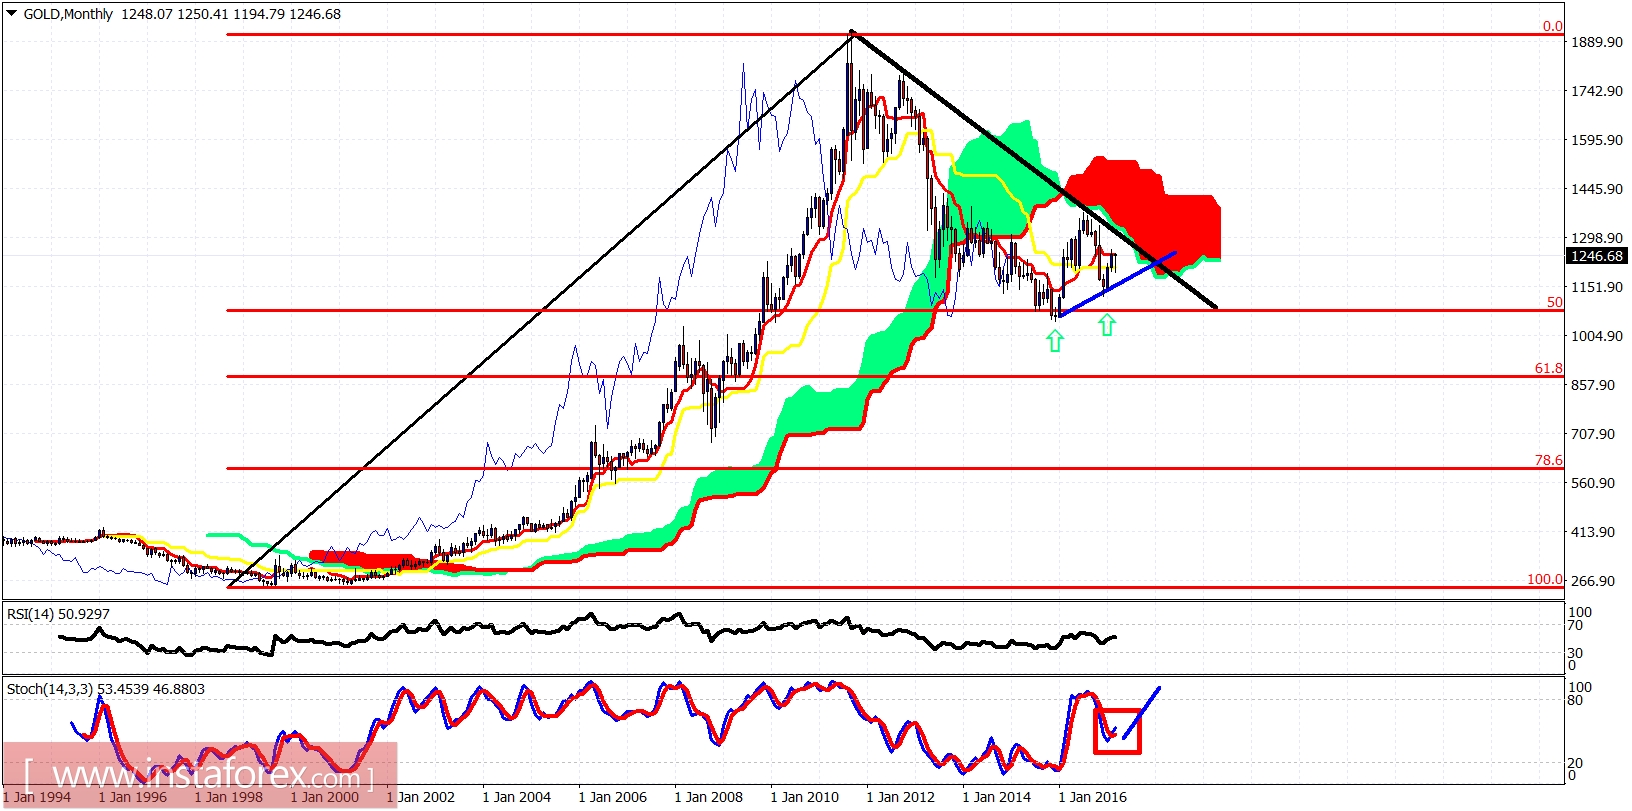
Gold is rising within an impulsive pattern. The price is in an uptrend. After making an important low at $1,194, gold is rising and is expected to move towards the key monthly resistance at $1,325. In the short term, gold prices are close or has already completed 5 waves up from $1,194.

Wave analysis of gold for March 22, 2017

Blue lines - expected price path

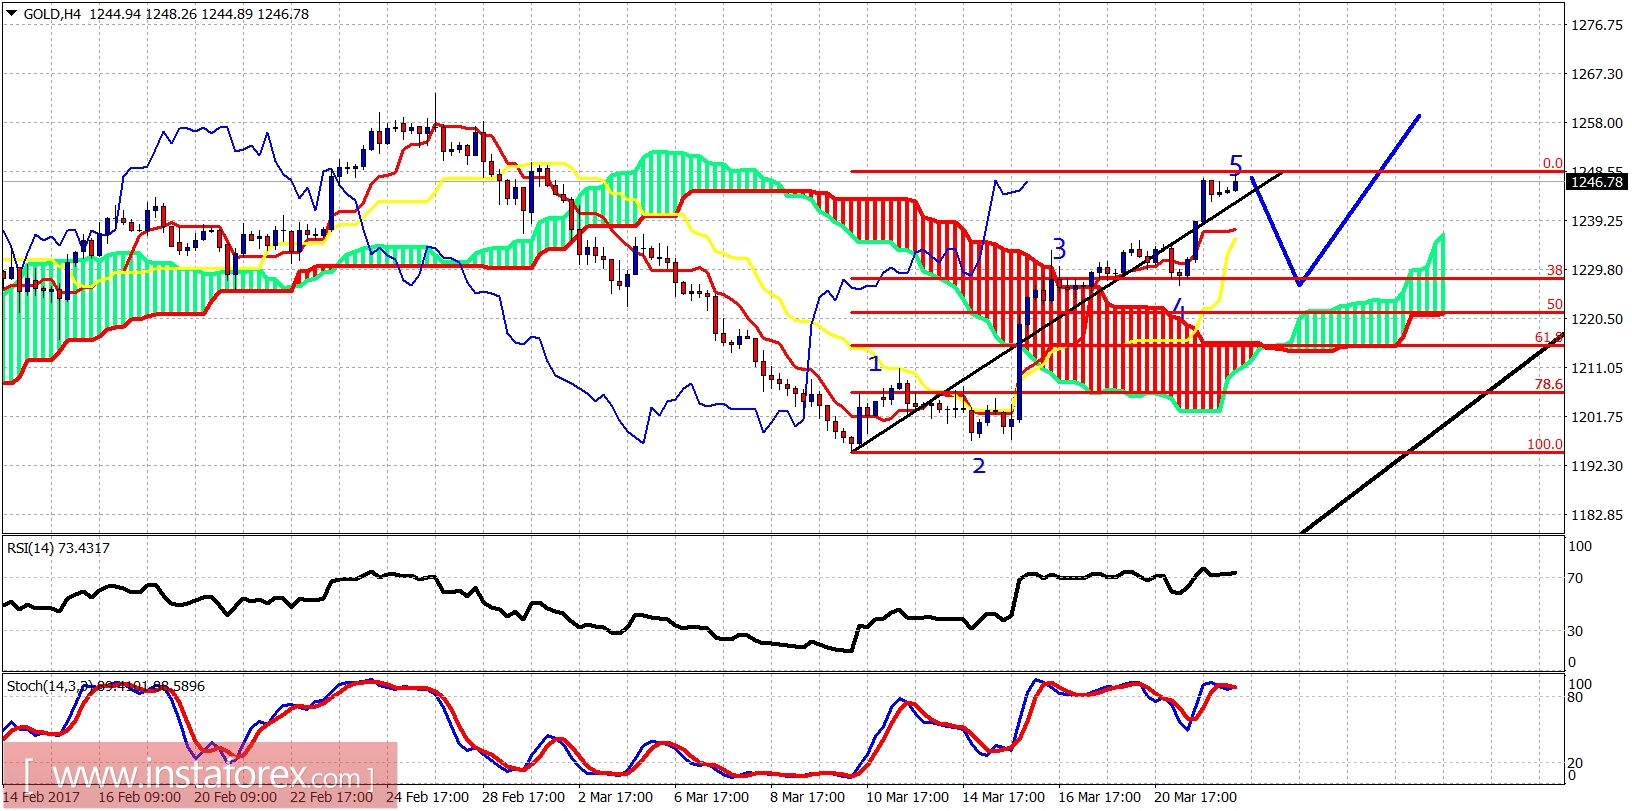
Gold is trading above the Ichimoku cloud. The short-term trend is bullish. The price may pull back towards the Ichimoku cloud and the 38% Fibonacci retracement. Gold has made an important low at $1,194 and as long as we trade above it, we are aggressively bullish.

Wave analysis of gold for March 22, 2017

Gold is in its second rising phase. The first phase started at the 2015 lows and ended at the 2016 highs. The 2017 low is a secondary higher low and will prove equally important to the 2015 lows. Gold price is expected to test the long-term downward sloping trend line from its all time highs and the monthly cloud resistance at $1,325.
Analyst InstaForex
Share this article:
parent
loader...
all-was_read__icon
You have watched all the best publications
presently.
We are already looking for something interesting for you...
all-was_read__star
Recently published:
loader...
More recent publications...