


The dollar index remains under pressure. The index is approaching the 99.25 area where the neckline of the Head and Shoulders pattern is found. This is the critical support. We could see a bounce off this area first before resuming lower, because there are divergence signs.
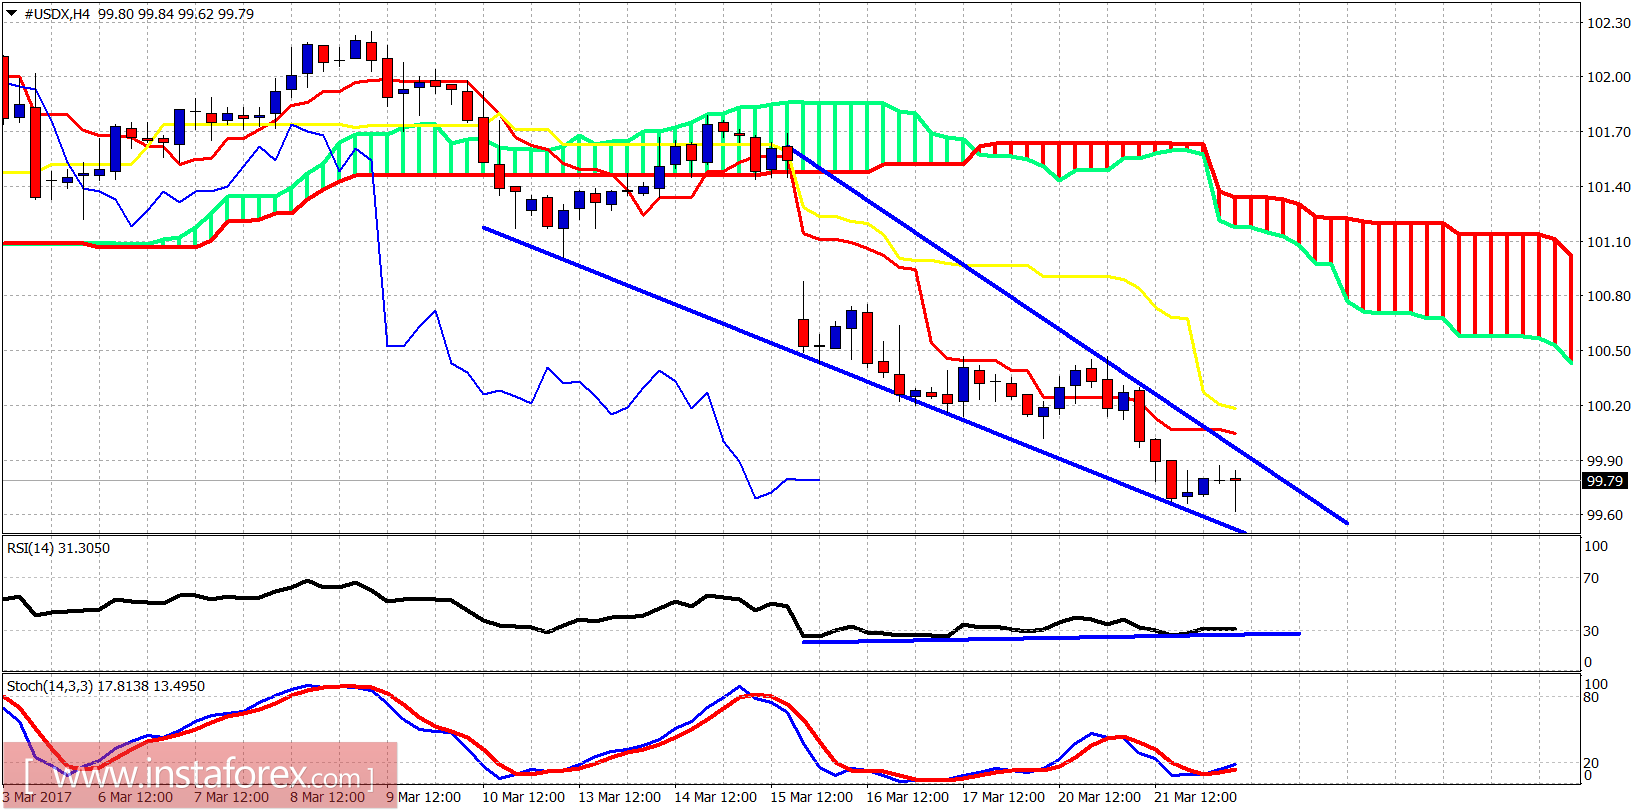
The dollar index is in a bearish trend making lower lows and lower highs. The price has formed a downward sloping wedge. The short-term resistance is at 100. The cloud resistance will be found at 101 in case we break above 100.
Green line - long-term support trend line
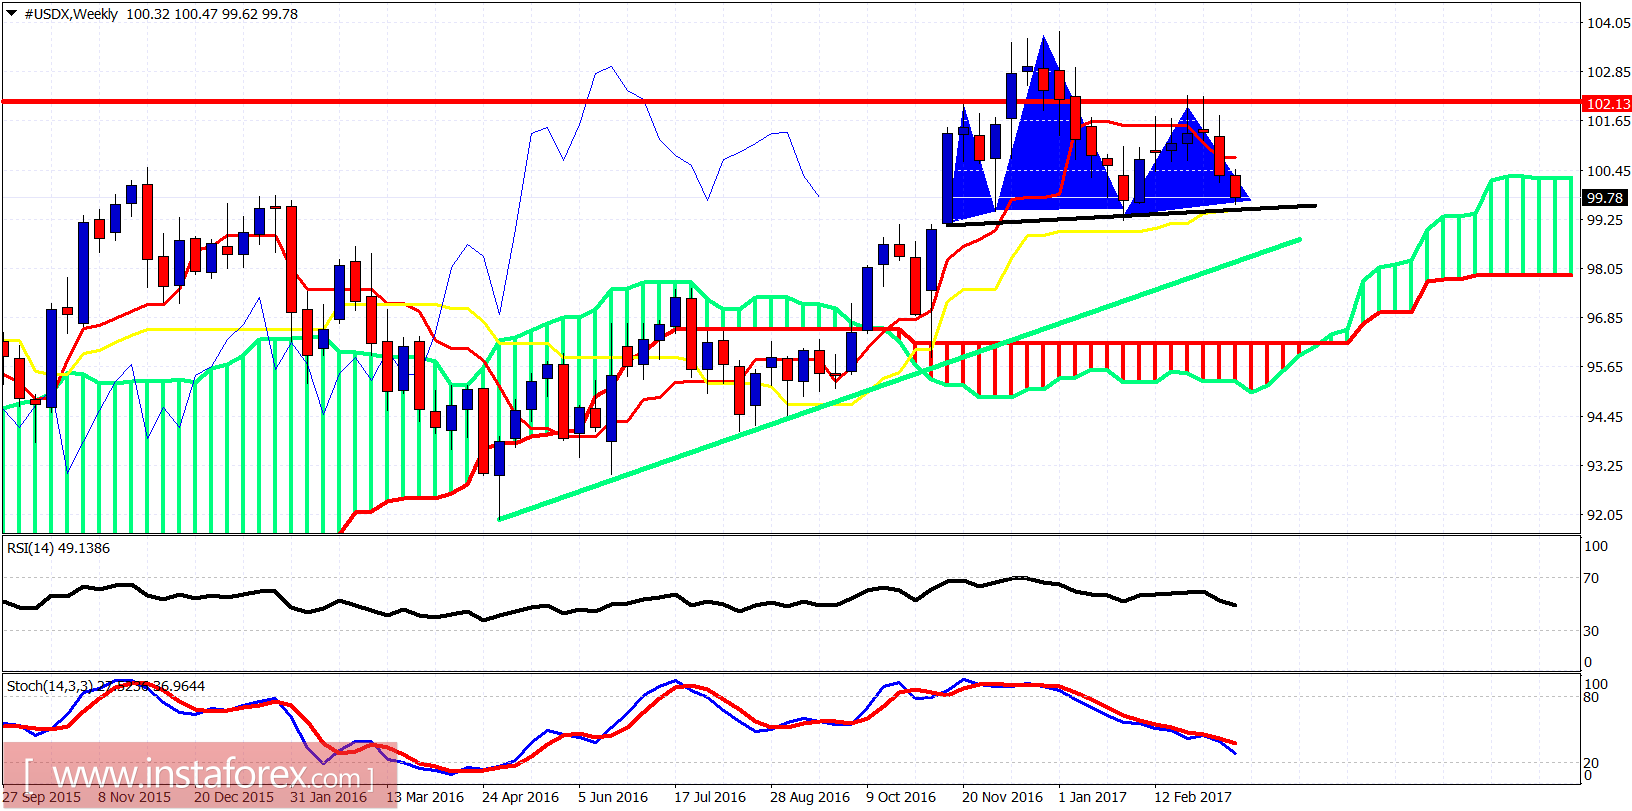
The dollar index is forming a bearish Head and Shoulders pattern. We talked about this pattern some time ago. If price breaks below the neckline support, we should expect the long-term support trend line to be tested at least.


