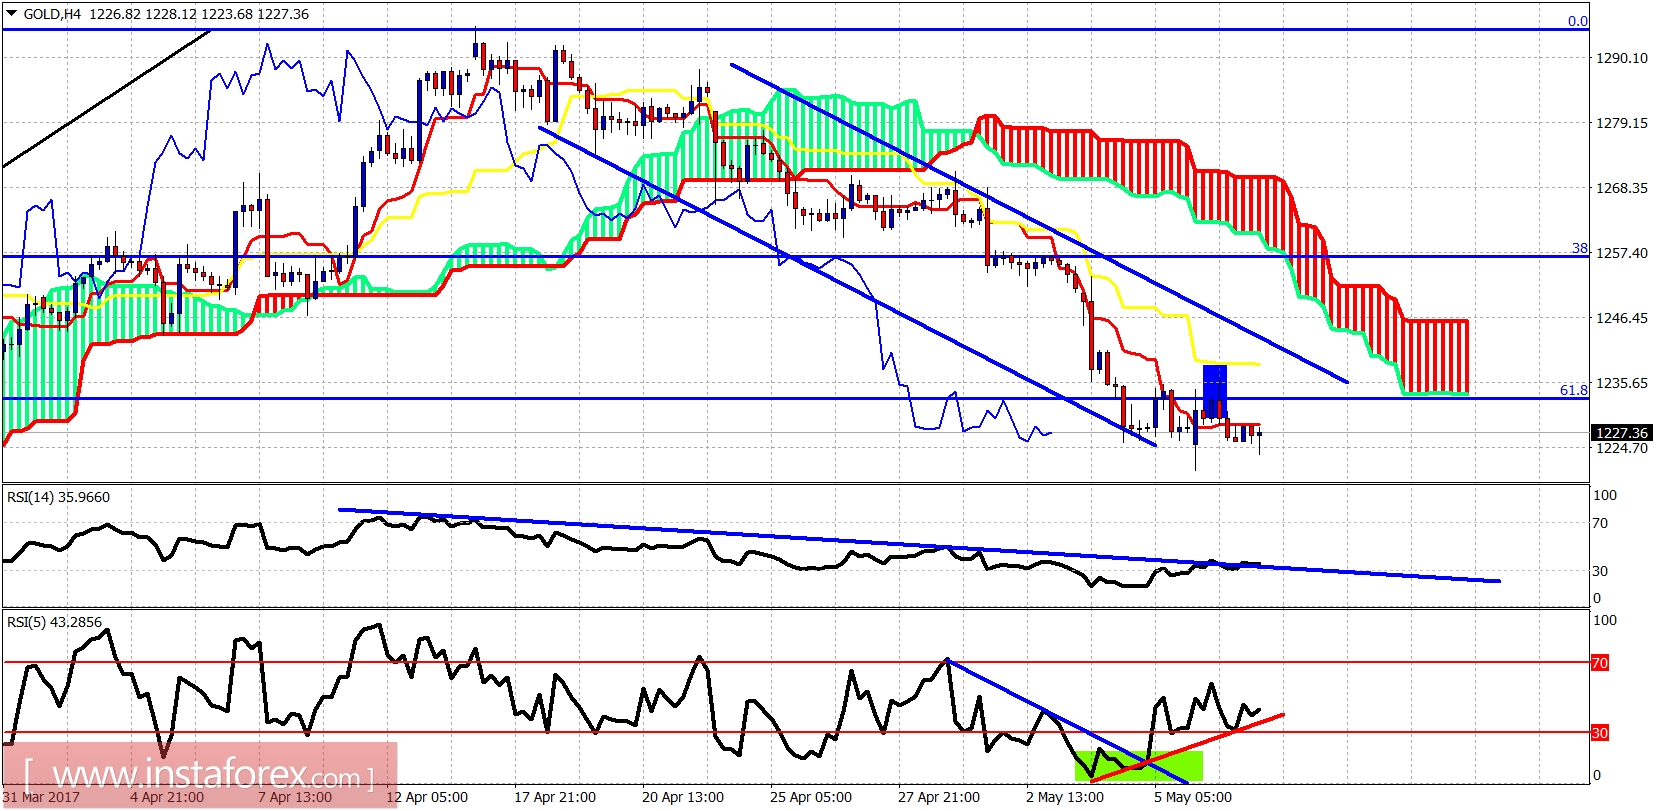
Gold price is trading around $1,220-$1,210 support area and the downside is limited currently. Price is expected to make a strong move higher at least towards $1,260.

Blue lines - bearish channel
Gold price is trading below the 4-hour Kumo (cloud) and has short-term resistance at $1,237 and next at $1,260. Trend is still bearish. Only a break above the Kumo will change trend to bullish and open the way for a push towards $1,400. If Gold price gets rejected at the cloud, we should expect the next downward move to push towards $1,180.

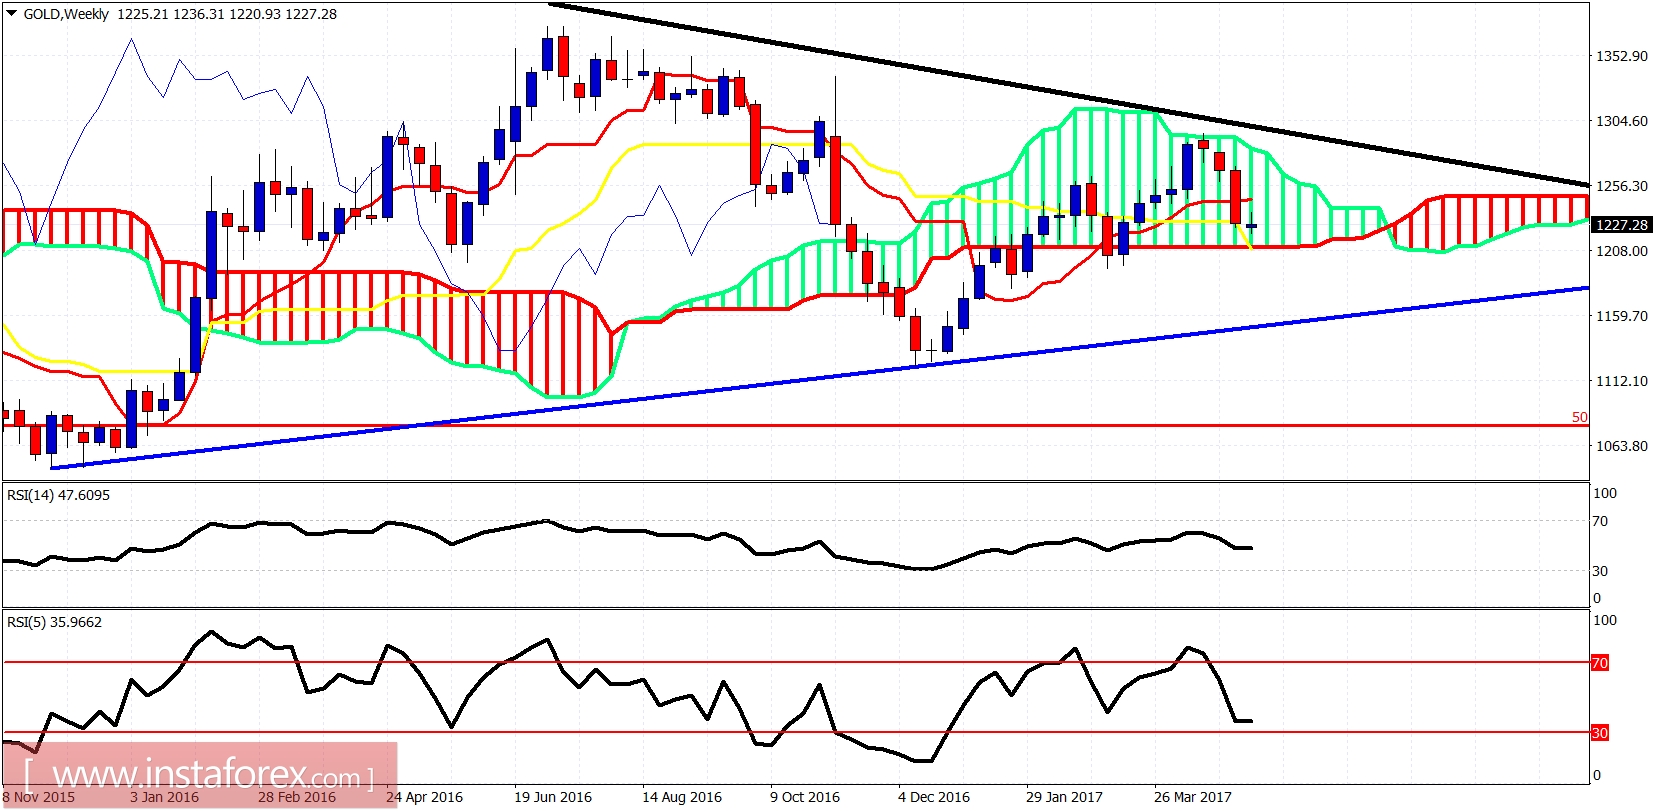
Blue line - support
Gold price held support at the lower cloud boundary. Price however remains inside the Kumo and weekly trend remains neutral. Bulls need a break above the black trend line resistance and above the Kumo at $1,290. The worst case scenario for bulls will be a pullback towards the blue trend line support at $1,160 before the next big leg up.


