Main Quotes Calendar Forum
flag

FX.co ★ Ichimoku indicator analysis of gold for May 26, 2017

parent
Forex Analysis:::2017-05-25T21:05:43

Ichimoku indicator analysis of gold for May 26, 2017

Gold price is forming a sideways triangle price action. This tightening range will soon provide a break out and a clear signal. I believe that it is more probable the breakout to be to the upside.

Ichimoku indicator analysis of gold for May 26, 2017

Blue lines -triangle pattern

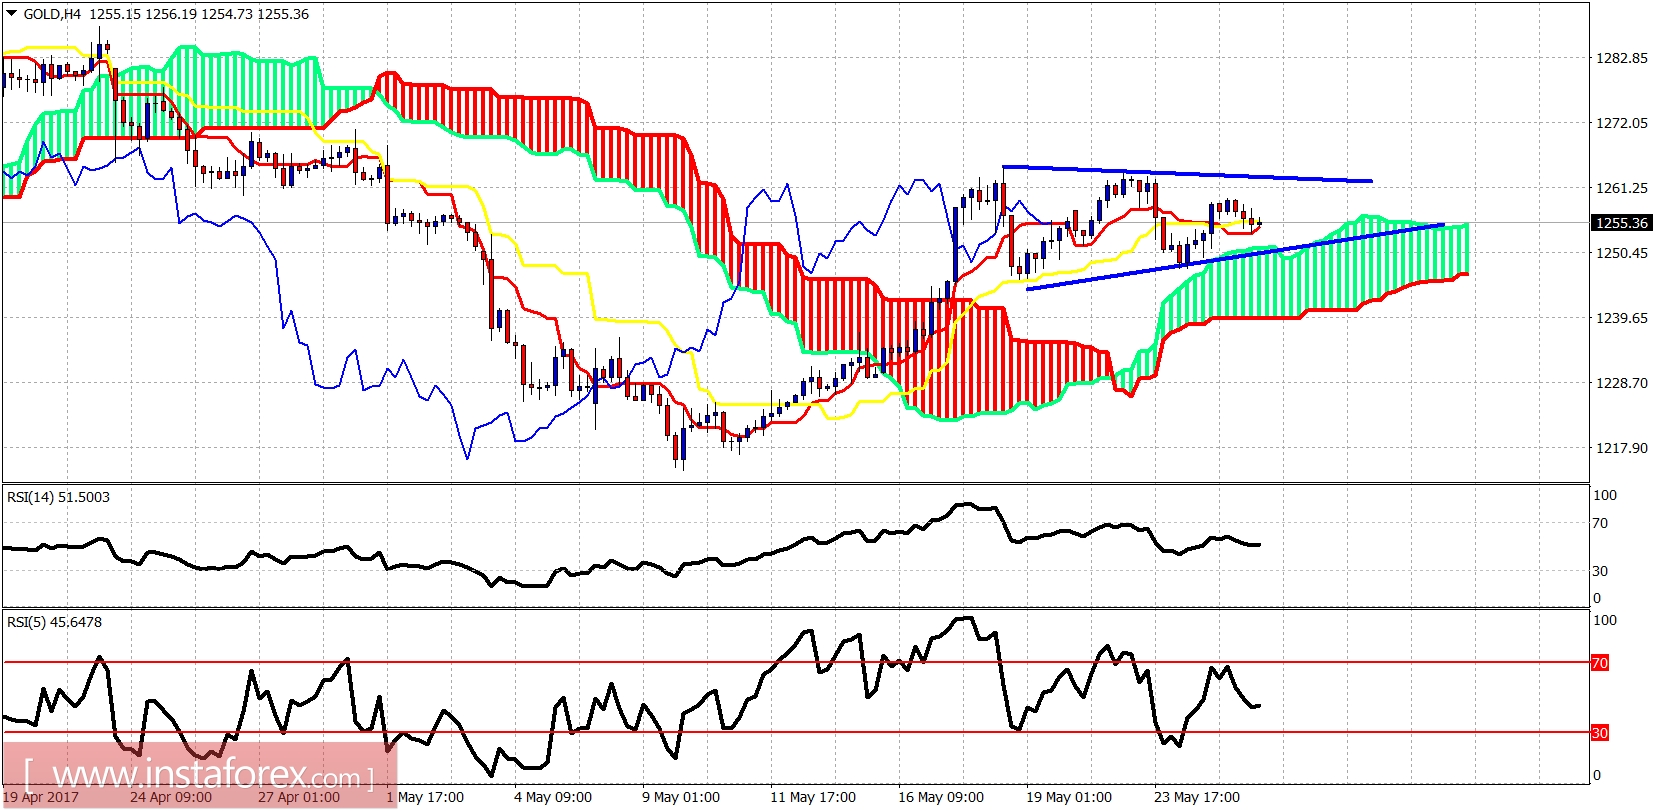
Gold price is trading around the tenkan- and kijun-sen indicators above the 4-hour Ichimoku cloud. Trend is neutral in the short term. Resistance is at $1,263. Support is at $1,250.

Ichimoku indicator analysis of gold for May 26, 2017

On a daily basis Gold price has been trading inside a price range for 6 sessions

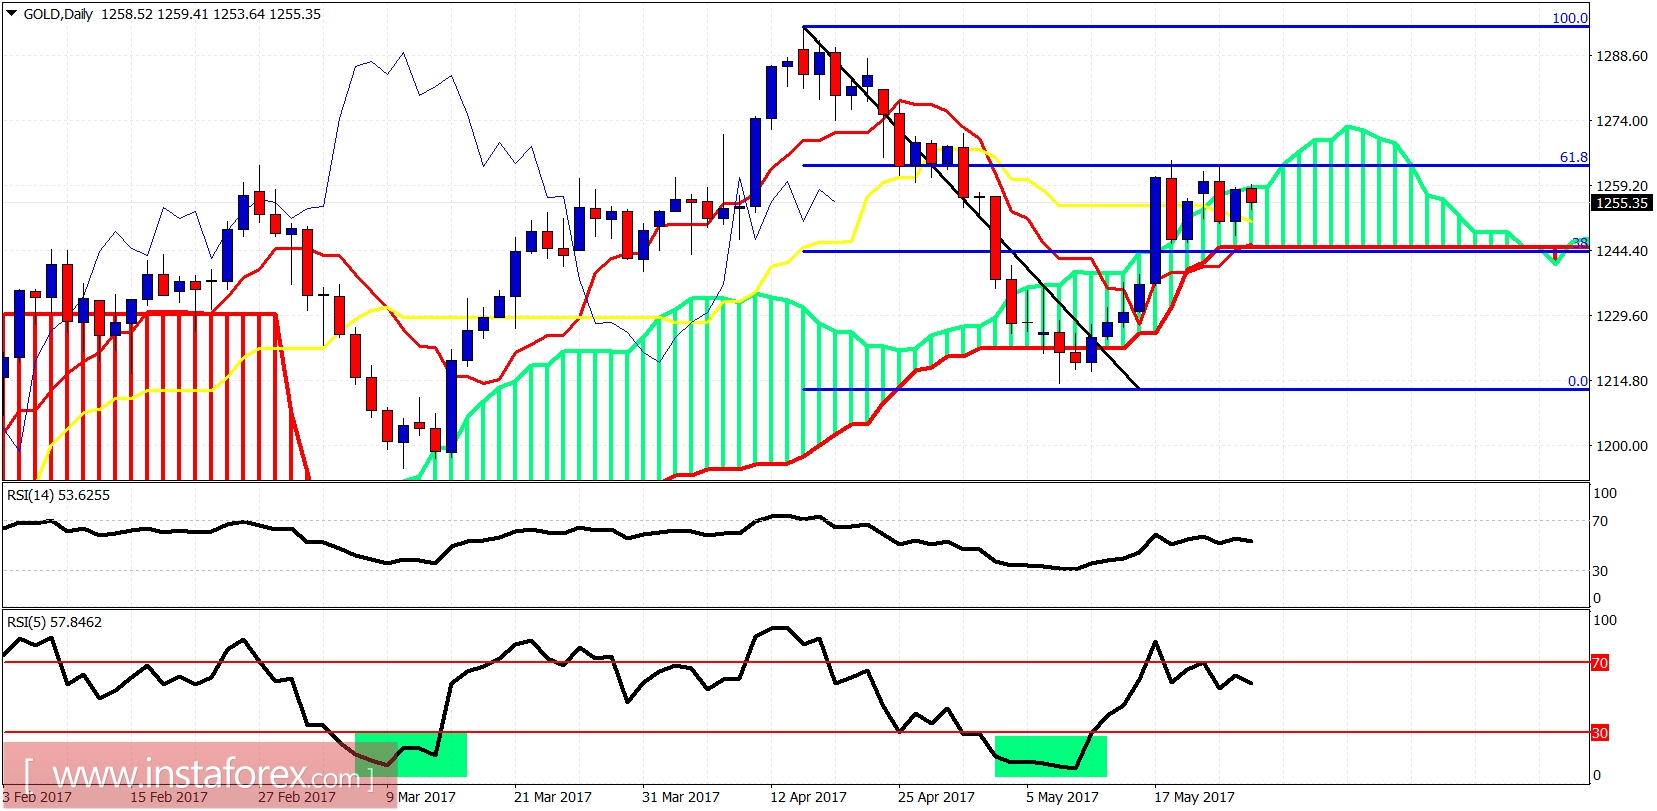
in a row. Price is near the upper cloud boundary and a daily close above it will be a bullish sign that will push price towards $1,280-$1,300. A close below $1,245 will be a bearish sign as price will be below the daily cloud.

Analyst InstaForex
Share this article:
parent
loader...
all-was_read__icon
You have watched all the best publications
presently.
We are already looking for something interesting for you...
all-was_read__star
Recently published:
loader...
More recent publications...