


The Dollar index is moving sideways. Price has formed a triangle pattern. Soon we will have a breakout. I believe it is more probable to break to the downside towards 96 before a bigger bounce higher.
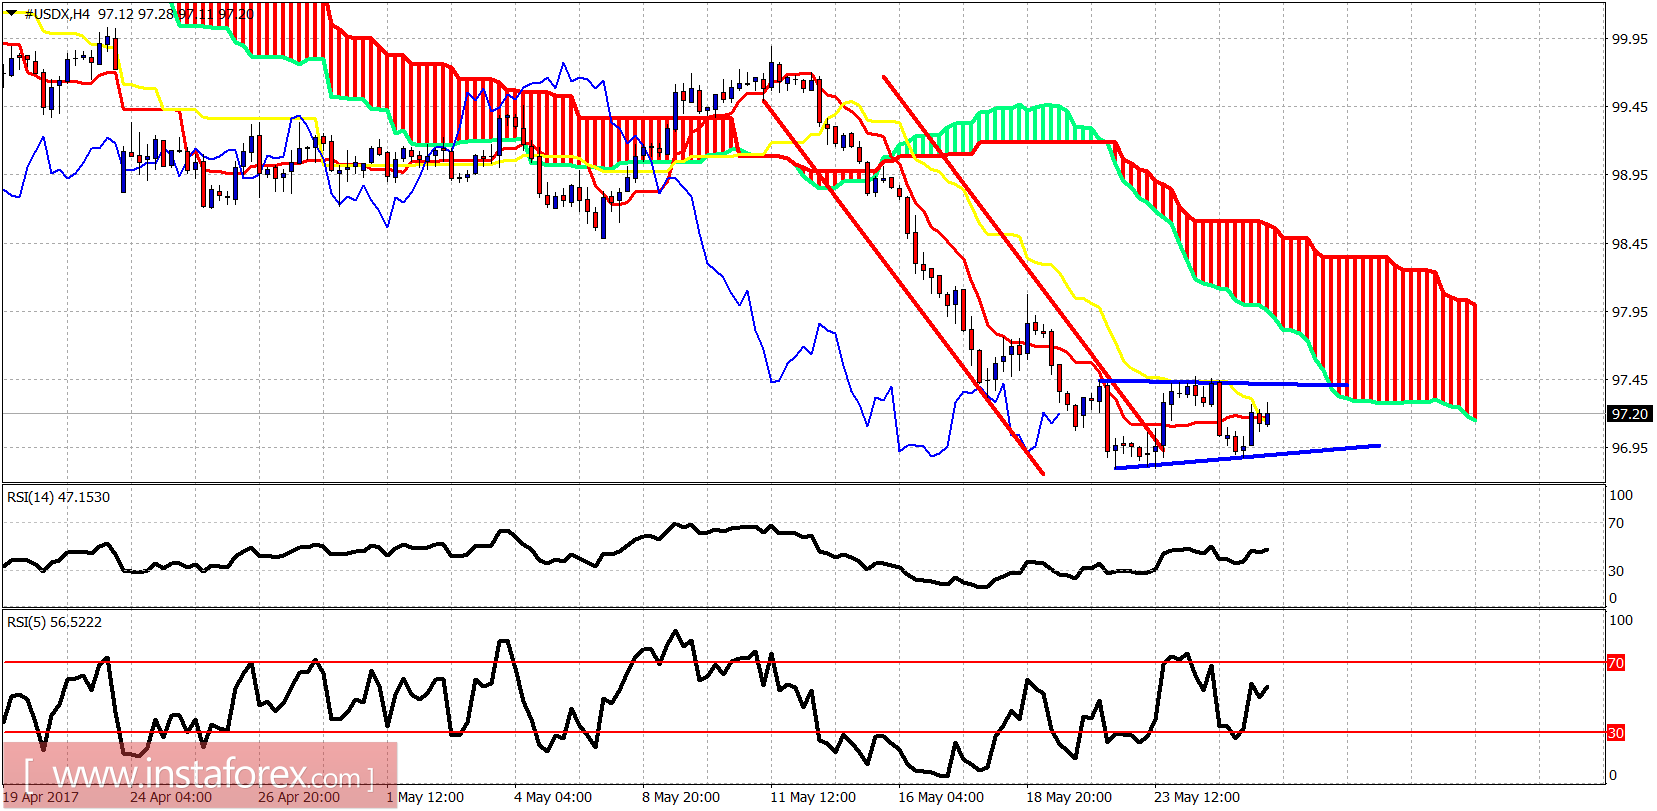
The Dollar index remains below the 4-hour Kumo (cloud). Trend remains bearish as price cannot even break above the kijun-sen indicator. Support is at 96.90 and resistance is at 97.45. I believe it is more probable to break to new lows before a bigger bounce.
Green line - broken support trend line
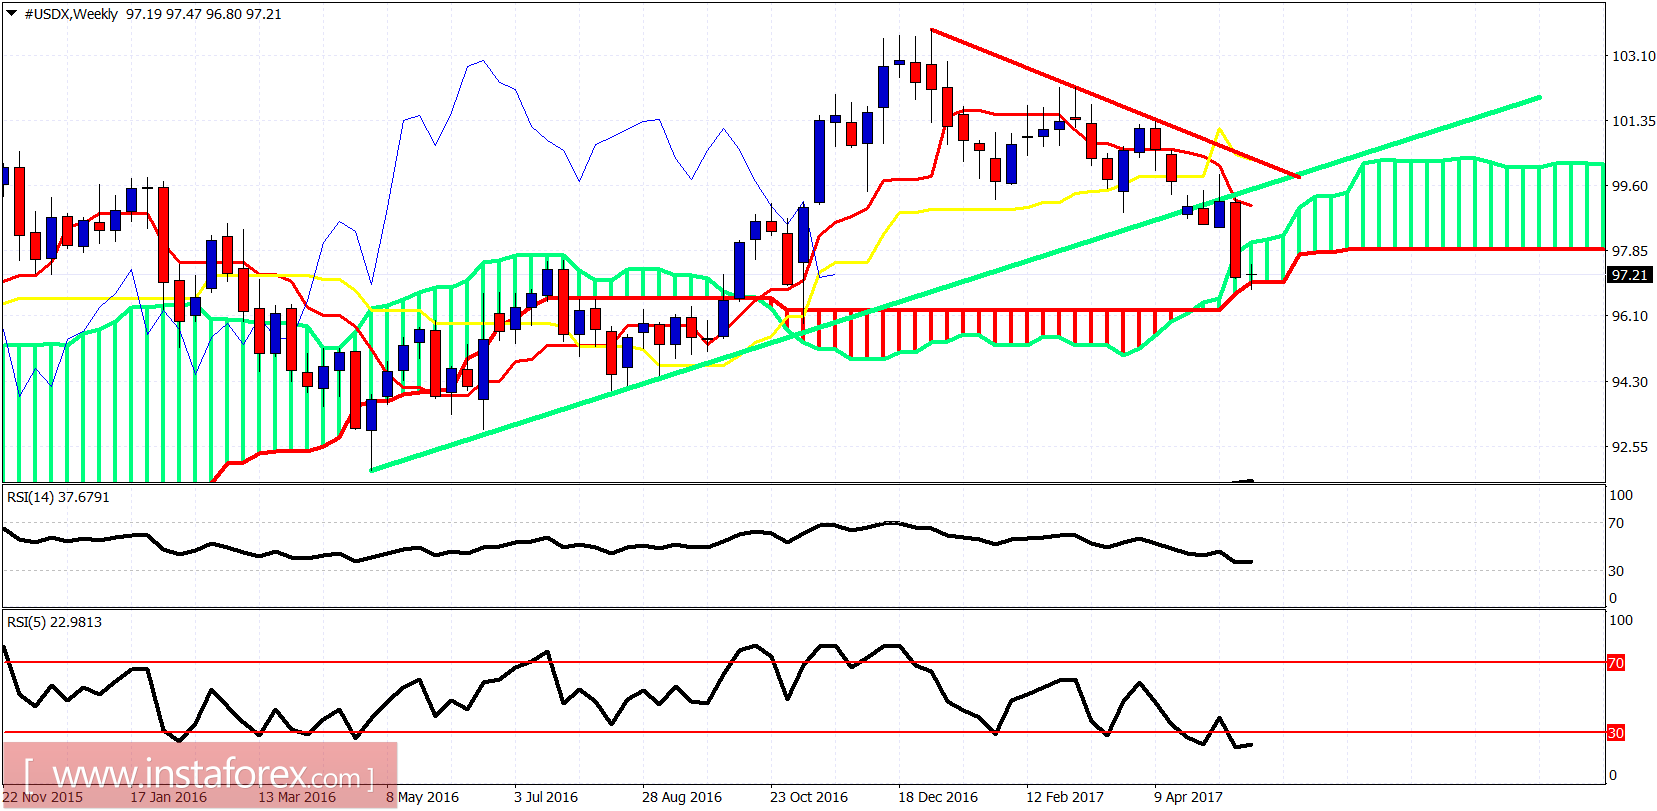
Price is still at the edge of the weekly cloud. Price is at very important support. We could see the Kumo break but I believe a bigger reversal bounce will come over the next weeks. 96 is the next target if the short-term triangle is broken.


