Main Quotes Calendar Forum
flag

FX.co ★ Ichimoku indicator analysis of gold for June 15, 2017

parent
Forex Analysis:::2017-06-15T06:45:58

Ichimoku indicator analysis of gold for June 15, 2017

Gold price reached the Ichimoku cloud resistance as expected at $1,280 and got rejected. This rejection implies that the entire corrective move is not over and we should expect to see Gold price fall below the $1,259 area and near $1,245-50.

Ichimoku indicator analysis of gold for June 15, 2017

Gold price is below the Kumo in the 4hour chart. The rejection is a very bearish sign for Gold. Price is below the 38% Fibonacci retracement. I can see Gold price reach the 61.8% Fibonacci retracement. Trend is bearish.

Ichimoku indicator analysis of gold for June 15, 2017

Black line - long-term resistance trend line

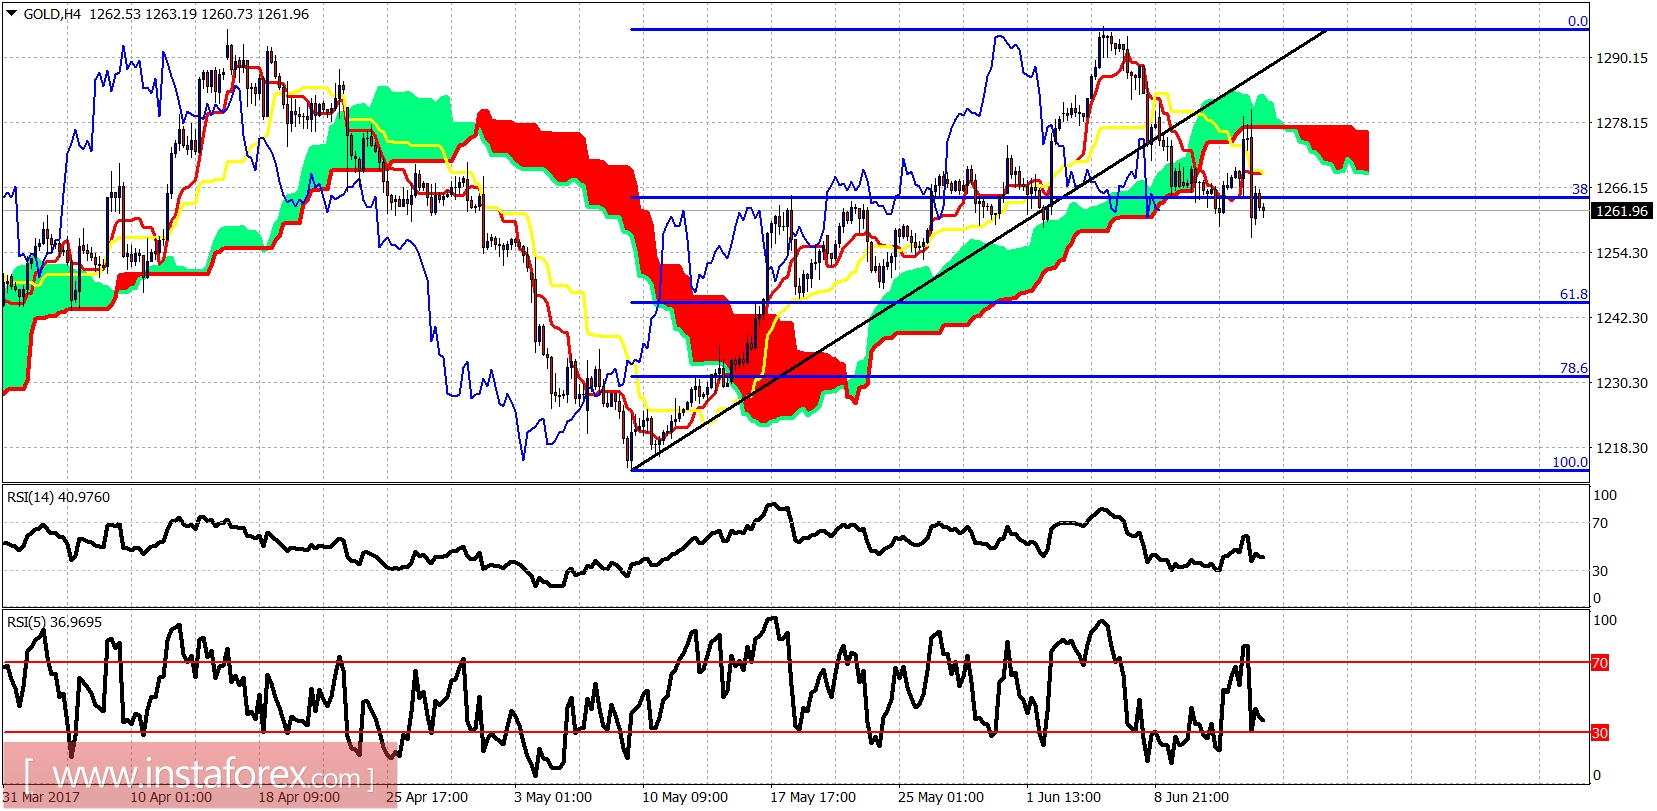
Red line - short-term support trend line

Blue line- long-term support trend line

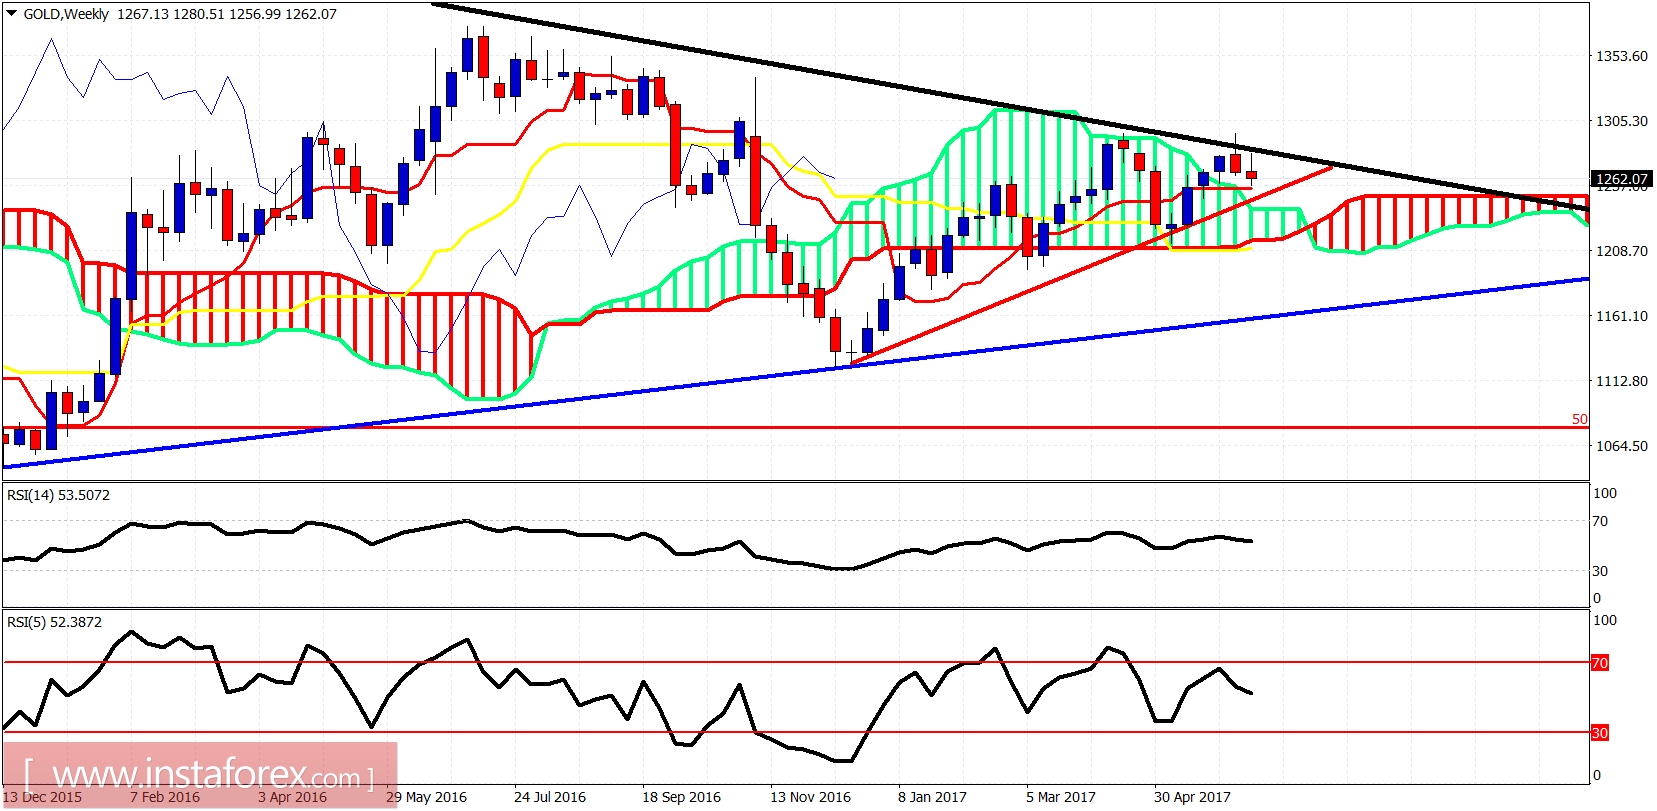
The weekly chart continues to favor a pullback towards the weekly Kumo near $1,240. I continue to be bullish long-term and expect Gold price to eventually reverse upwards and break above the black trend line. The buy zone is at $1,200-$1,245.

Analyst InstaForex
Share this article:
parent
loader...
all-was_read__icon
You have watched all the best publications
presently.
We are already looking for something interesting for you...
all-was_read__star
Recently published:
loader...
More recent publications...