


Despite the Dollar weakness all day long yesterday, after the FOMC the Dollar showed reversal signs. There are important bullish divergence signs that imply the Dollar should bounce strongly from current levels.

Blue line - support
Short-term resistance is at 97.50. Support at 96.50-96.30. Despite the new lower low yesterday, prices snapped back upwards. Price remains below the cloud and below the important red trend line resistance. Price is mainly moving sideways since late May.
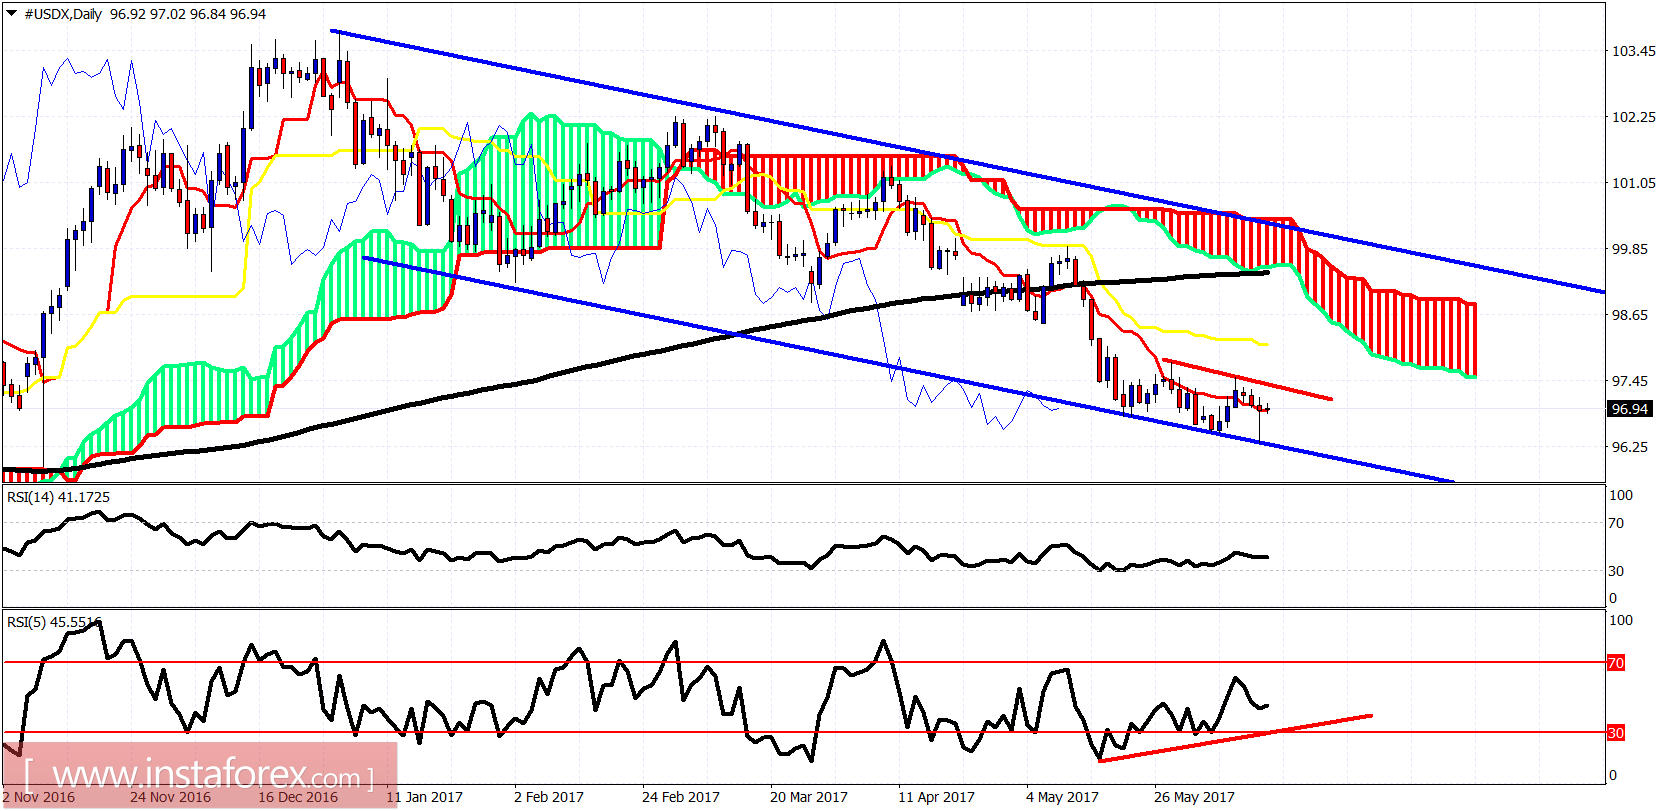
Blue lines - bearish channel
The Daily chart in the Dollar index shows clearly the divergence signs while trading on top of the lower channel boundary. Price behavior like this usually is followed by a sharp move higher. I expect price to reach the daily Kumo resistance area around 98.50-99 once the red trend line is broken.


