


Gold price remains in a bearish trend as the price has not managed to break above short-term resistance of $1,260. The price is at a weekly support level and bears should be very cautious.
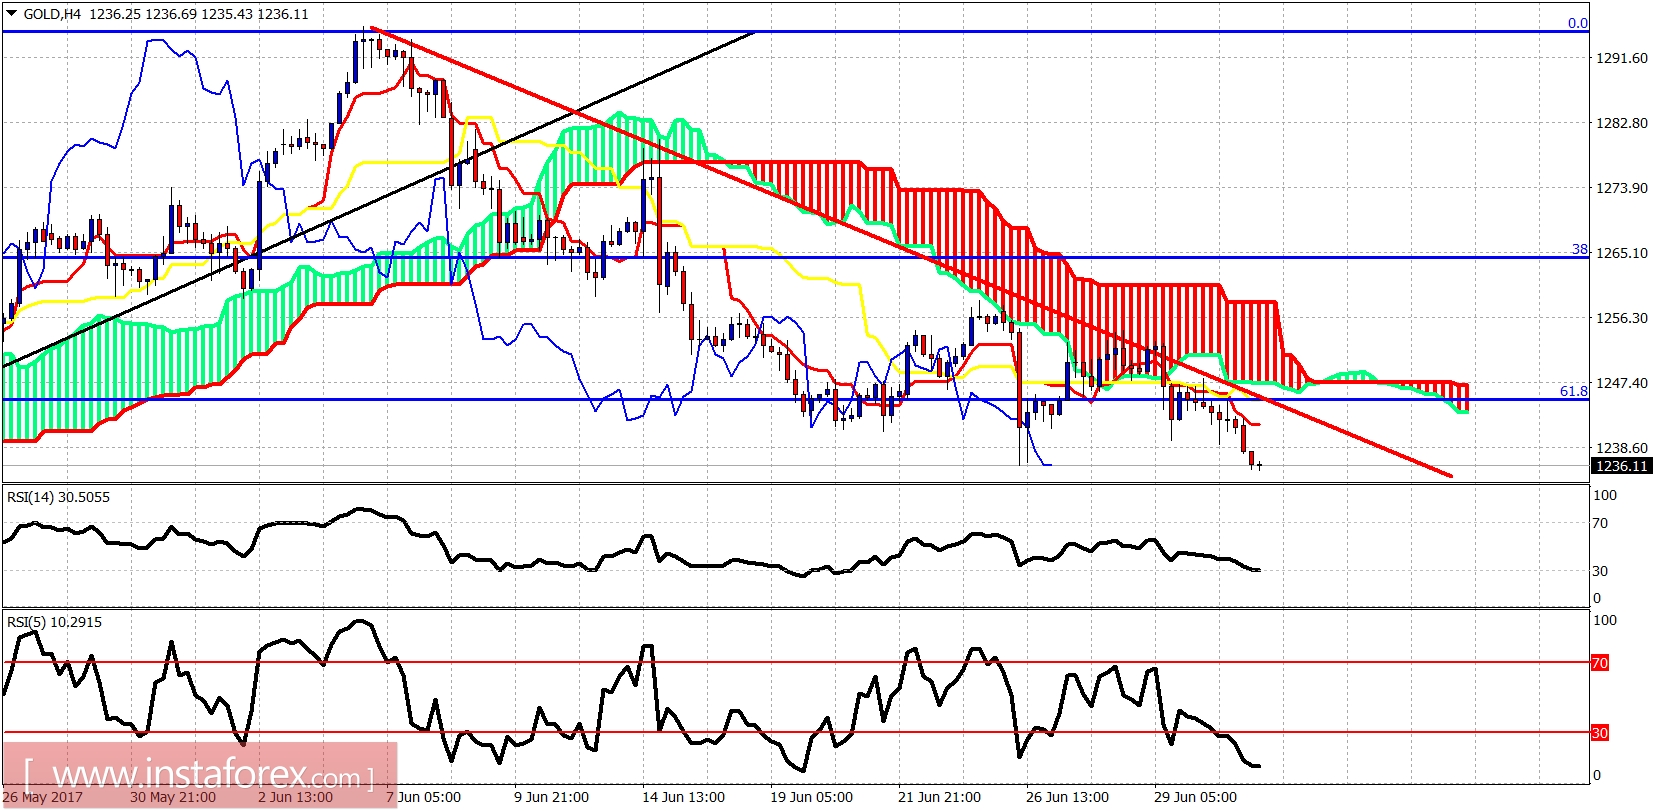
Red line - resistance
Price is below the 4 hour Kumo (cloud) and the red trend line resistance. Short-term trend is bearish as long as the price is below $1,250-60 area. There are some divergence signs that provide a warning for bears and we should not ignore them. Short positions should be protected.
Green line - short-term support
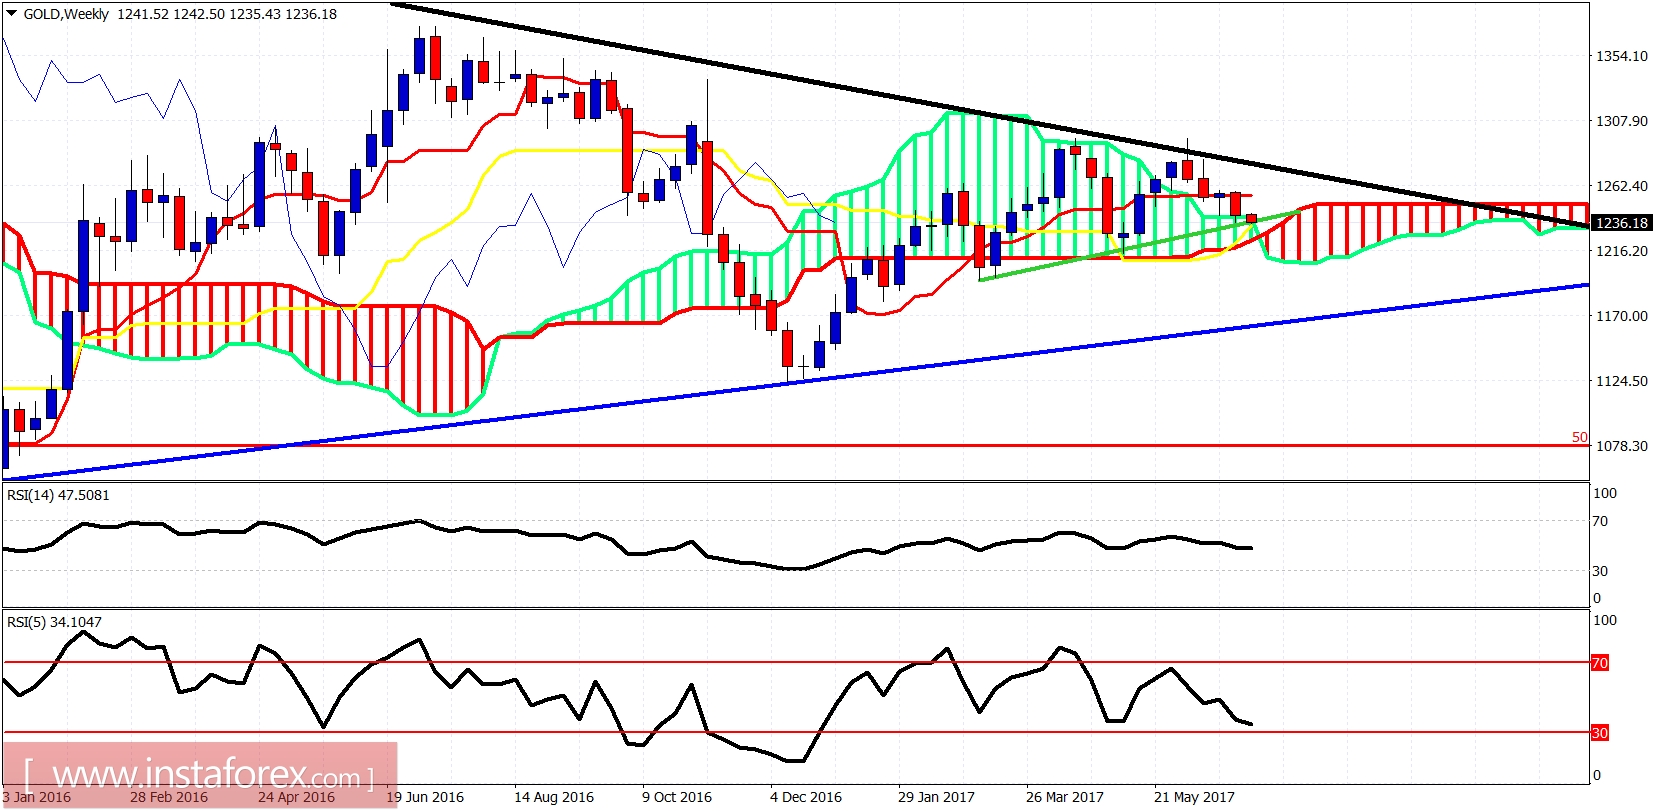
Blue line -long-term support
Long-term price action remains trapped inside the long-term triangle pattern. Price is now testing important weekly trend line and Kumo (cloud) support at the $1,235 area. A bounce and start of a new upward move are highly possible from this price area. Bears should be very cautious. Confirmation of the start of the next upward move will come with the break of the black trend line resistance.


