


The Dollar index remains in a bearish trend. There are signs of a possible upward reversal at least for the short-term, so Dollar bears should be very cautious.
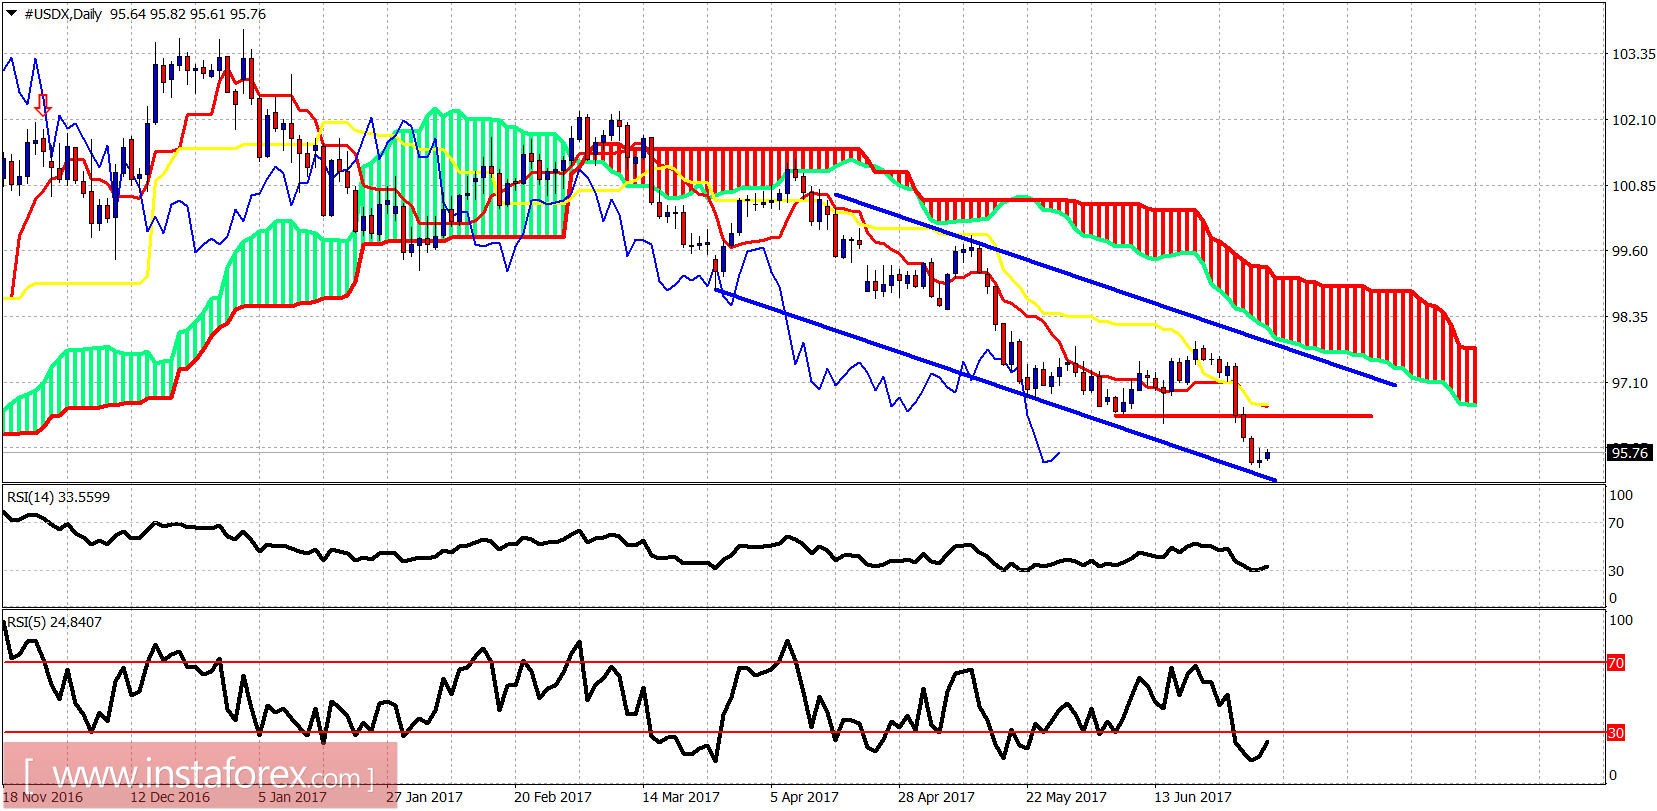
Red line - resistance
Price is inside a bearish channel. Price is trading below both the tenkan- and kijun-sen indicators. RSI (5) is oversold and turning upwards. This is a bullish short-term sign. This implies that a bounce towards the red line resistance and previous support is highly possible for the start of the week.
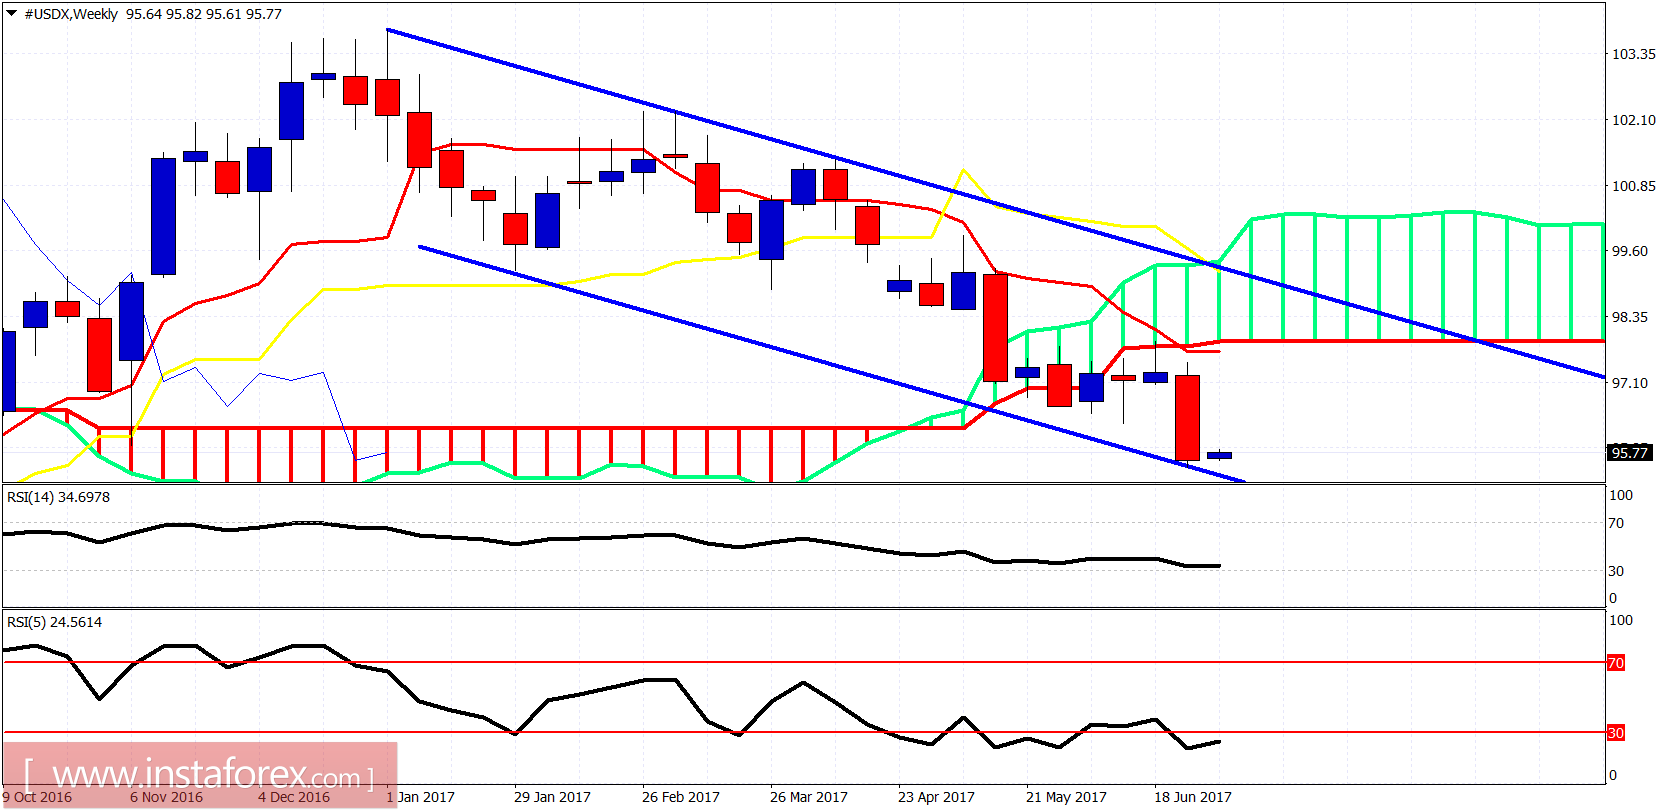
The weekly trend is bearish. The oscillators are diverging and the price is touching the lower channel boundary. A bounce towards the upper channel boundary or at least the lower Kumo boundary is justified. So a bounce towards 98-98.50 is awaited. No reversal confirmation yet. Bears should be cautious.


