


Gold price remains in a bearish trend making new lows below $1,235 area towards $1,220. The precious metal is getting even more oversold and I believe we will soon have an opportunity to see a very important low and reversal.
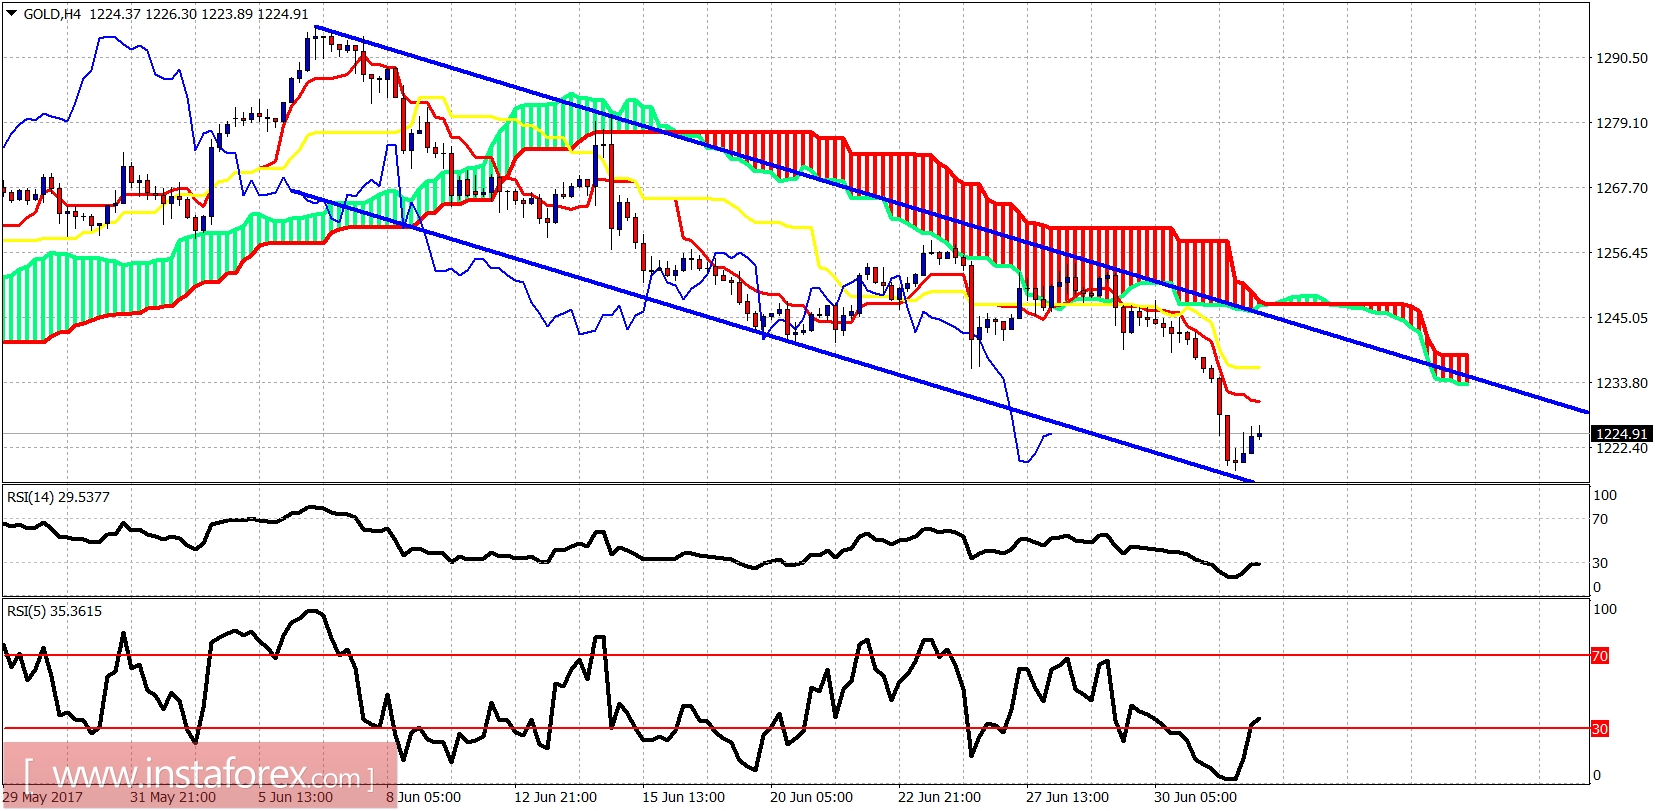
Gold price is below both the tenkan- and kijun-sen. Price is also bouncing off the bearish blue channel and we could at least see a bounce towards the 4 hour Kumo (cloud) and the upper channel boundary near $1,240-45.
Blue line - long-term support
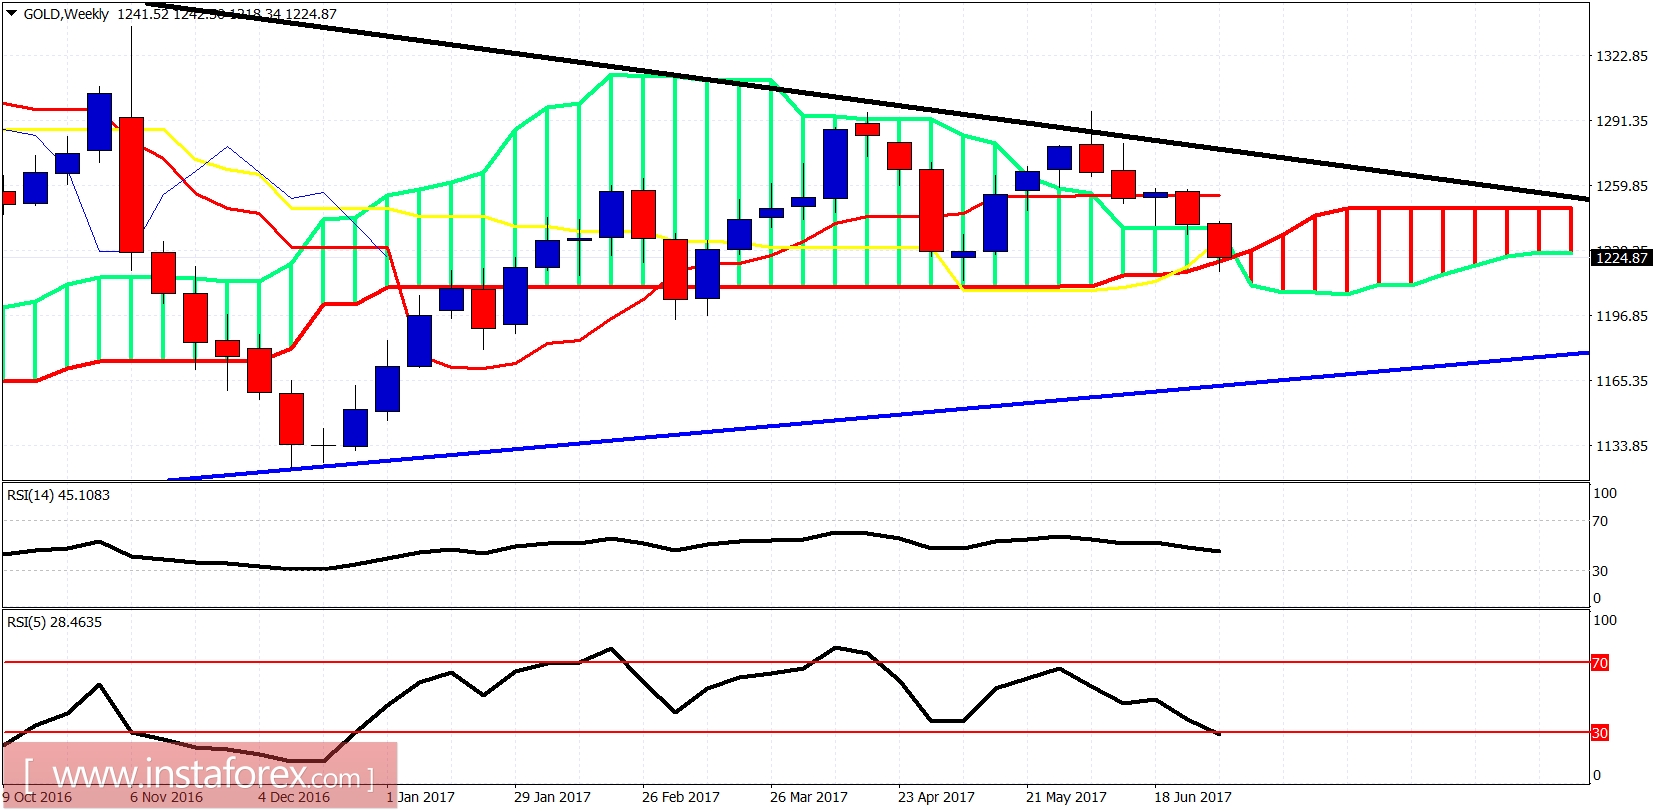
The gold weekly candle is testing the weekly Kumo. This is very important support. If price breaks below the cloud we could see a move even lower towards the blue long-term support trend line near $1,170.


