


The Gold price made a new lower low yesterday near $1,217 but sharply bounced back towards resistance of $1,230. There are divergence signs that imply Gold should make a strong bounce soon.
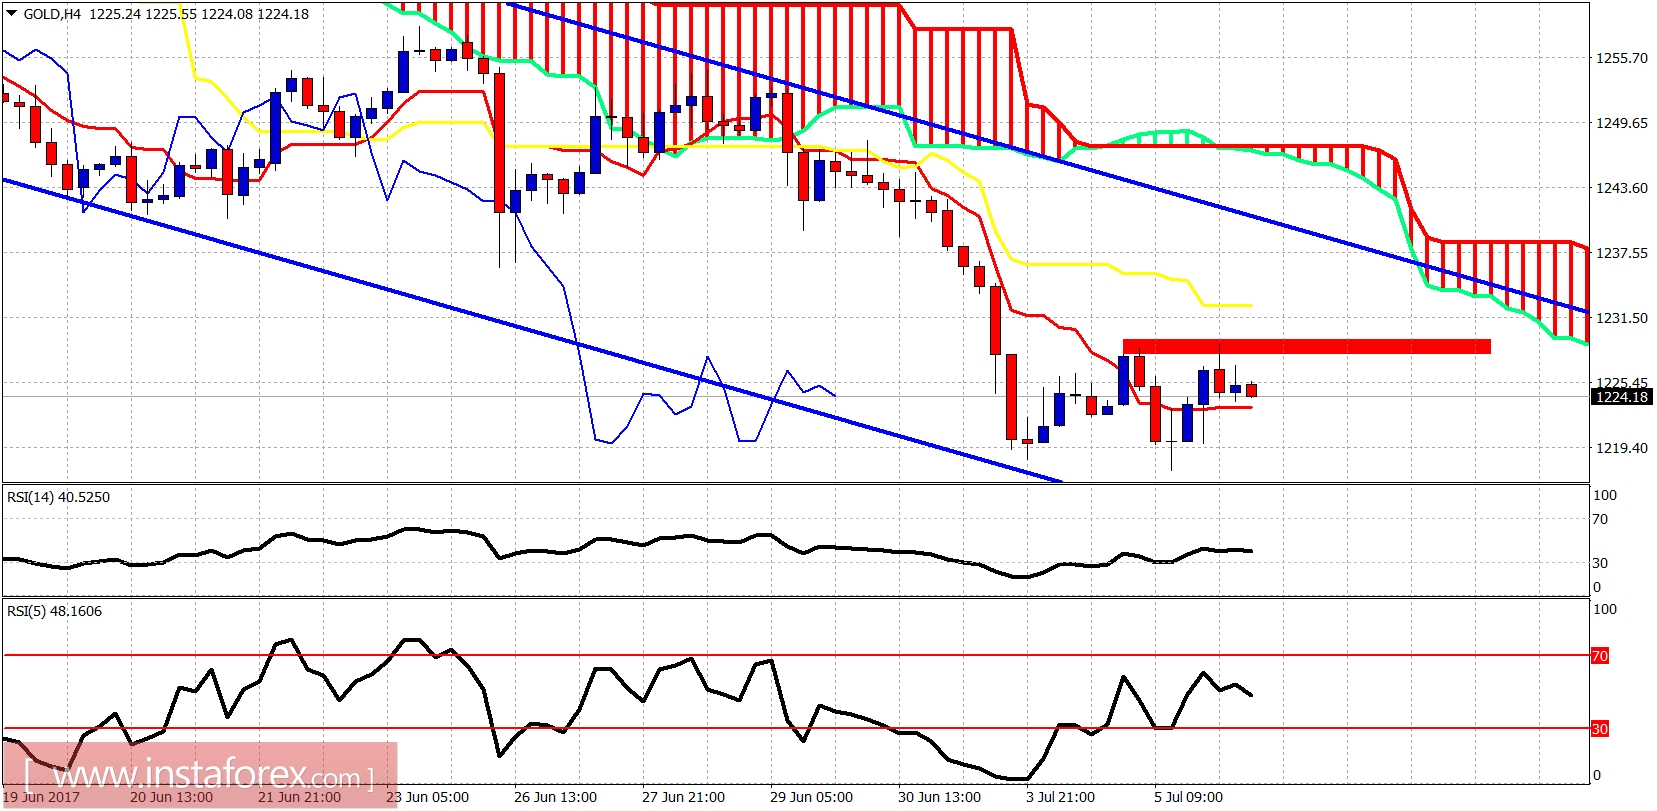
Red rectangle - resistance
The Gold price remains inside the bearish channel and below the 4 hour Kumo. Short-term trend is clearly bearish. But the divergent RSI indicators and the 5 wave decline from $1,253 imply a bounce should be expected soon. The target for a minimum bounce is at $1,237.
Blue line - long-term support
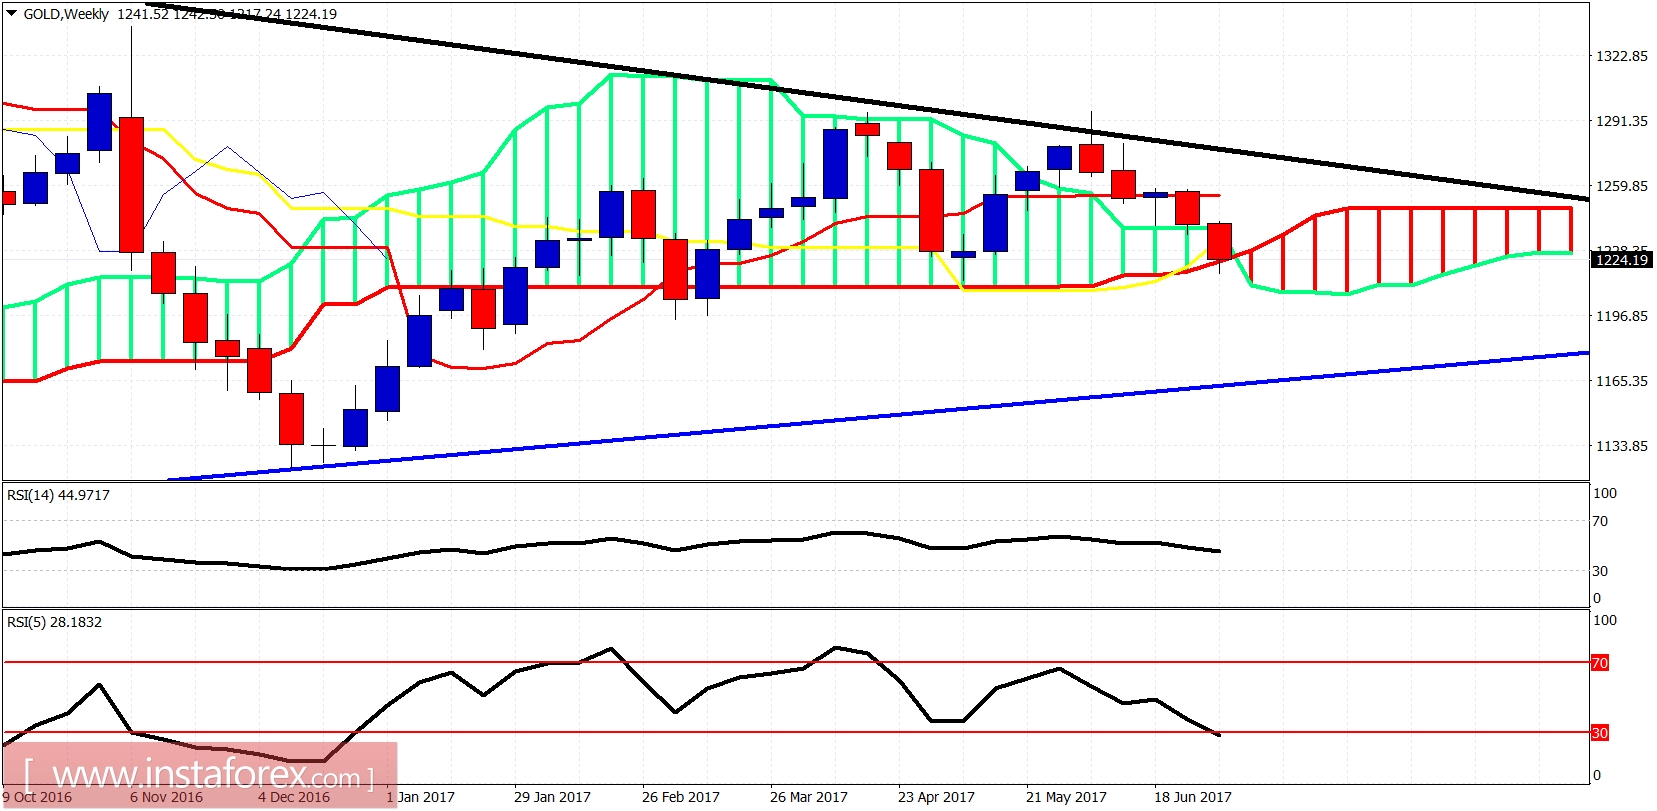
The Gold weekly candle remains on top of the weekly Kumo (cloud) support. Resistance is at $1,280. Support is at $1,170. I cannot rule out a move towards $1,170 but I believe it is more probable to see a strong bounce at least towards $1,260 from current levels than fall straight down to $1,170.


