Main Quotes Calendar Forum
flag

FX.co ★ Ichimoku indicator analysis of USDX for July 6, 2017

parent
Forex Analysis:::2017-07-06T07:04:47

Ichimoku indicator analysis of USDX for July 6, 2017

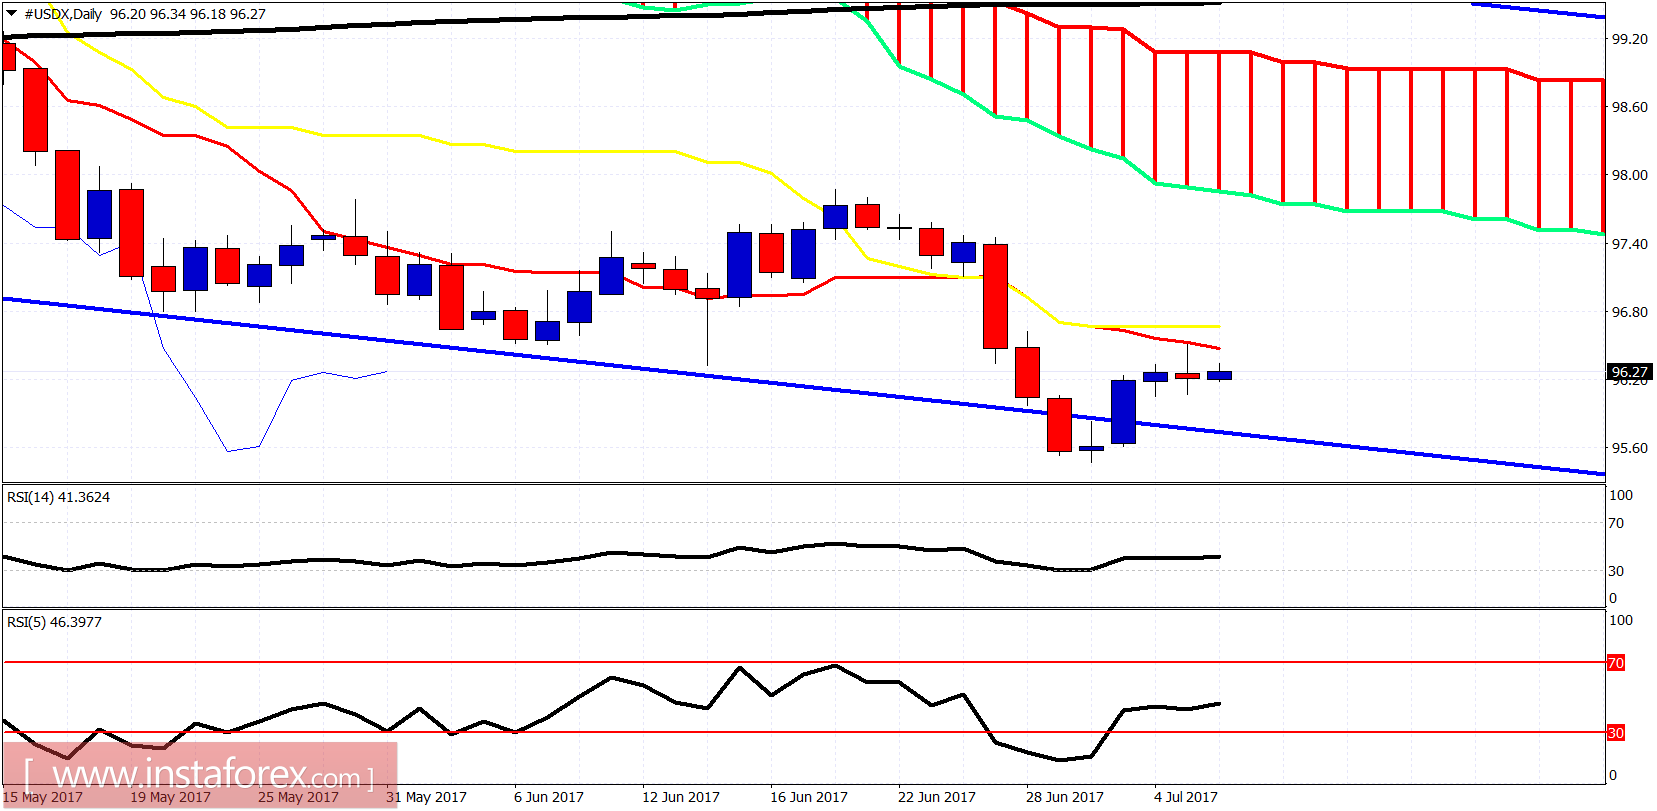
The Dollar index continued its bounce towards 96.5 resistance but got rejected. Bulls need to hold above 96 and make a higher low before the next leg up. Trend remains bearish and there is no trend reversal confirmation yet.

Ichimoku indicator analysis of USDX for July 6, 2017

Red line - resistance

The Dollar index bounced towards the 4-hour Kumo (cloud) and trend line resistance at 96.50 and got rejected. This increases the chances of making a new lower low. However if support at 96 holds, we could see a higher low being formed before the next leg up towards 98.50.

Ichimoku indicator analysis of USDX for July 6, 2017

In the daily chart, the trend remains clearly bearish as price remains below both the tenkan- and kijun-sen indicators. Resistance is at 96.50-96.80 and if broken we should expect price to move towards the daily Kumo at 97.50-98.
Analyst InstaForex
Share this article:
parent
loader...
all-was_read__icon
You have watched all the best publications
presently.
We are already looking for something interesting for you...
all-was_read__star
Recently published:
loader...
More recent publications...