Main Quotes Calendar Forum
flag

FX.co ★ Ichimoku indicator analysis of USDX for July 7, 2017

parent
Forex Analysis:::2017-07-07T06:57:40

Ichimoku indicator analysis of USDX for July 7, 2017

The Dollar index is making a higher low so far as the decline from the rejection at 96.50 has stopped around the 61.8% Fibonacci retracement. Trend remains bearish but I prefer to be on the lookout for a reversal.

Ichimoku indicator analysis of USDX for July 7, 2017

Price is trading below both the tenkan- and kijun-sen indicators. Trend is bearish. But I believe we are in a process of making a higher low and then a new upward move should follow. Short-term resistance levels that need to be broken are at 96.30 and then at 96.55.

Ichimoku indicator analysis of USDX for July 7, 2017

Blue lines - bearish channel

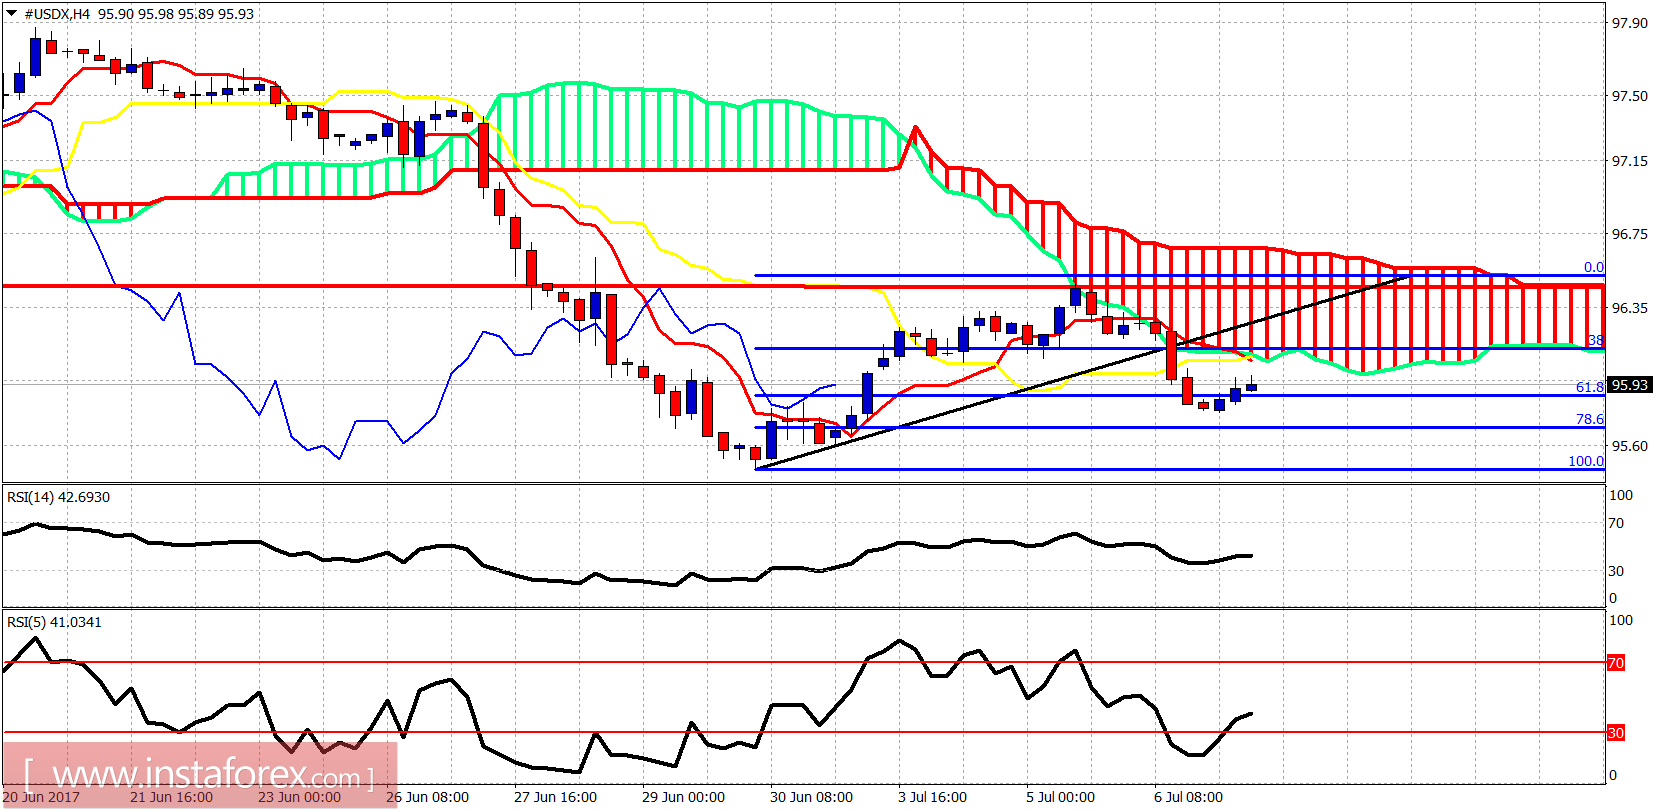
Trading for so long on top of the lower channel boundary implies that an explosive upward move will come. Trend is bearish as price is below the tenkan- and kijun-sen indicators. Breaking above them (96.50-96.70) will be a very bullish sign and push price towards 98-98.50.

Analyst InstaForex
Share this article:
parent
loader...
all-was_read__icon
You have watched all the best publications
presently.
We are already looking for something interesting for you...
all-was_read__star
Recently published:
loader...
More recent publications...