


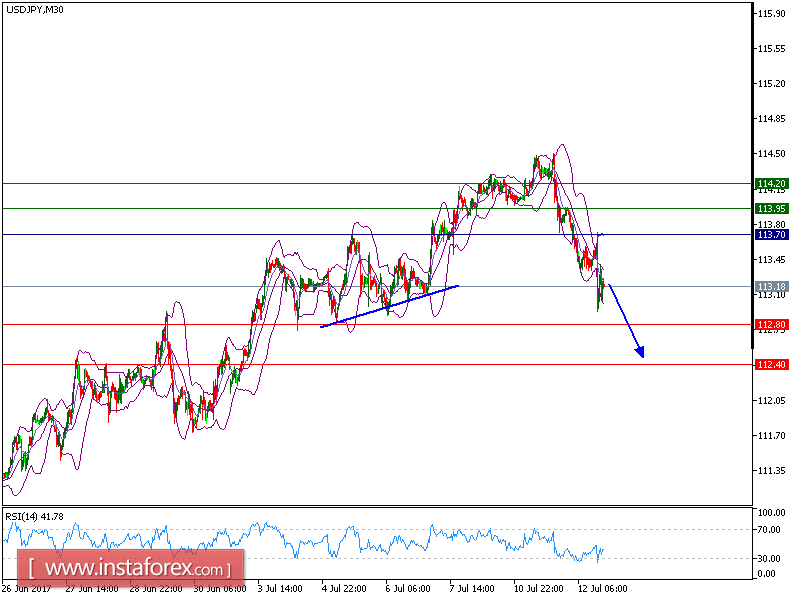
USD/JPY is under pressure and expected to continue its downside movement. The pair broke below both 20-period and 50-moving averages with strong downside momentum. In addition, the bearish cross between 20-period and 50-period moving averages has been identified, which indicates the bearish signal. The relative strength index is bearish and calls for a further decline.
Hence, as long as 113.20 is not surpassed, look for a new drop to 112.80 and even to 112.40 in extension.
Alternatively, if the price moves in the opposite direction as predicted, along position is recommended above 113.70 with a target at 114.20.
Chart Explanation: The black line shows the pivot point. The current price above the pivot point indicates a bullish position while the price below the pivot point is a sign for a short position. The red lines show the support levels and the green line indicates the resistance level. These levels can be used to enter and exit trades.
Strategy : BUY , Stop Loss: 114, Take Profit: 114.90
Resistance levels: 113.95, 114.20, and 114.75
Support levels: 112.80,112.40, and 112.00


