


GBP/USD recovered from Wednesday's lows and it's testing once again the 200 SMA at H1 chart. However, the closest resistance is located around 1.2914, which is the last hurdle to overcome before to reach 1.3011 to the upside and it would be the confirmation that a bullish trend for the mid term has started. MACD indicator supports such scenario.
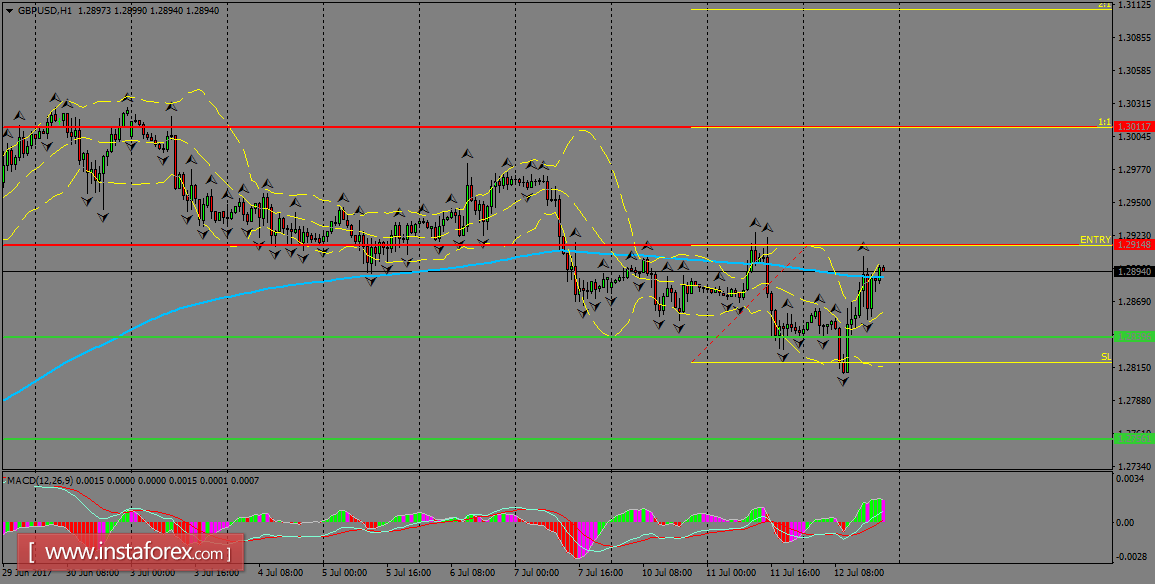
H1 chart's resistance levels: 1.2914 / 1.3011
H1 chart's support levels: 1.2839 / 1.2756
Trading recommendations for today: Based on the H1 chart, buy (long) orders only if the GBP/USD pair breaks a bullish candlestick; the resistance level is at 1.2914, take profit is at 1.3011 and stop loss is at 1.2818.


