


The pair is riding a bullish path and during Thursday's session, it managed to consolidate above the 200 SMA at H1 chart. Overall price action is still choppy and GBP/USD is directionless in the mid-term, but once it consolidates above the psychological zone of 1.3000, it can reach the 1.3011 level. MACD indicator is turning flat, favoring for sideways.
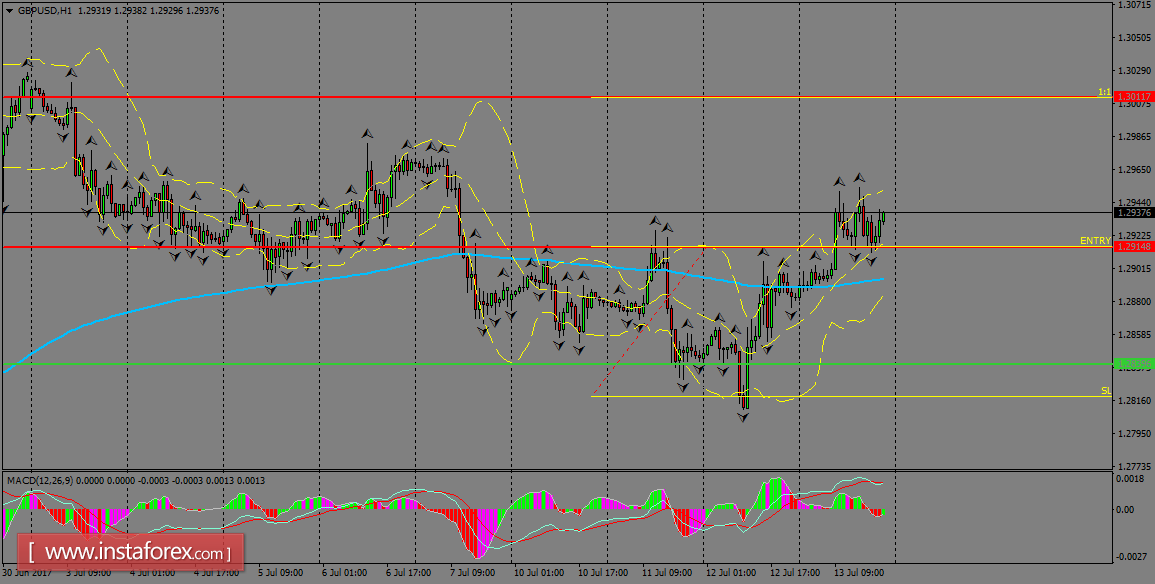
H1 chart's resistance levels: 1.2914 / 1.3011
H1 chart's support levels: 1.2839 / 1.2756
Trading recommendations for today: Based on the H1 chart, buy (long) orders only if the GBP/USD pair breaks a bullish candlestick; the resistance level is at 1.2914, take profit is at 1.3011 and stop loss is at 1.2818.


