


The Dollar index has broken below horizontal support at 95.50. Price is now trying back test the break out area. If the break down was real, we should see a rejection and a move lower.
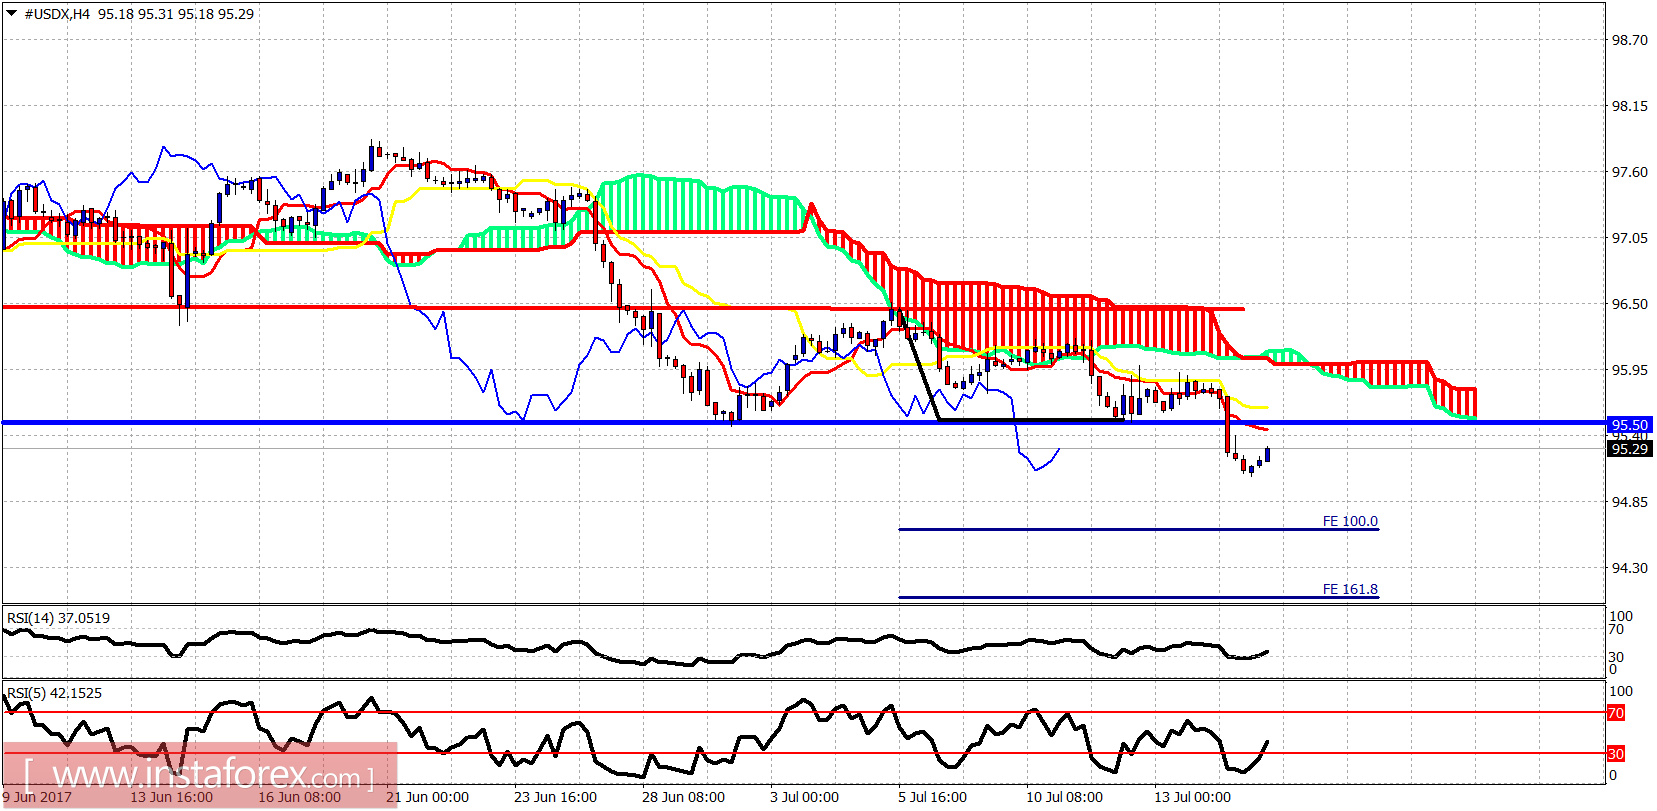
Red lines -resistance
Blue lines - support (broken)
The Dollar index has bearish target of 94.70. If however we see price break above 95.50 and 95.90 we should consider the breakdown as a false one. This would be a very bullish sign.
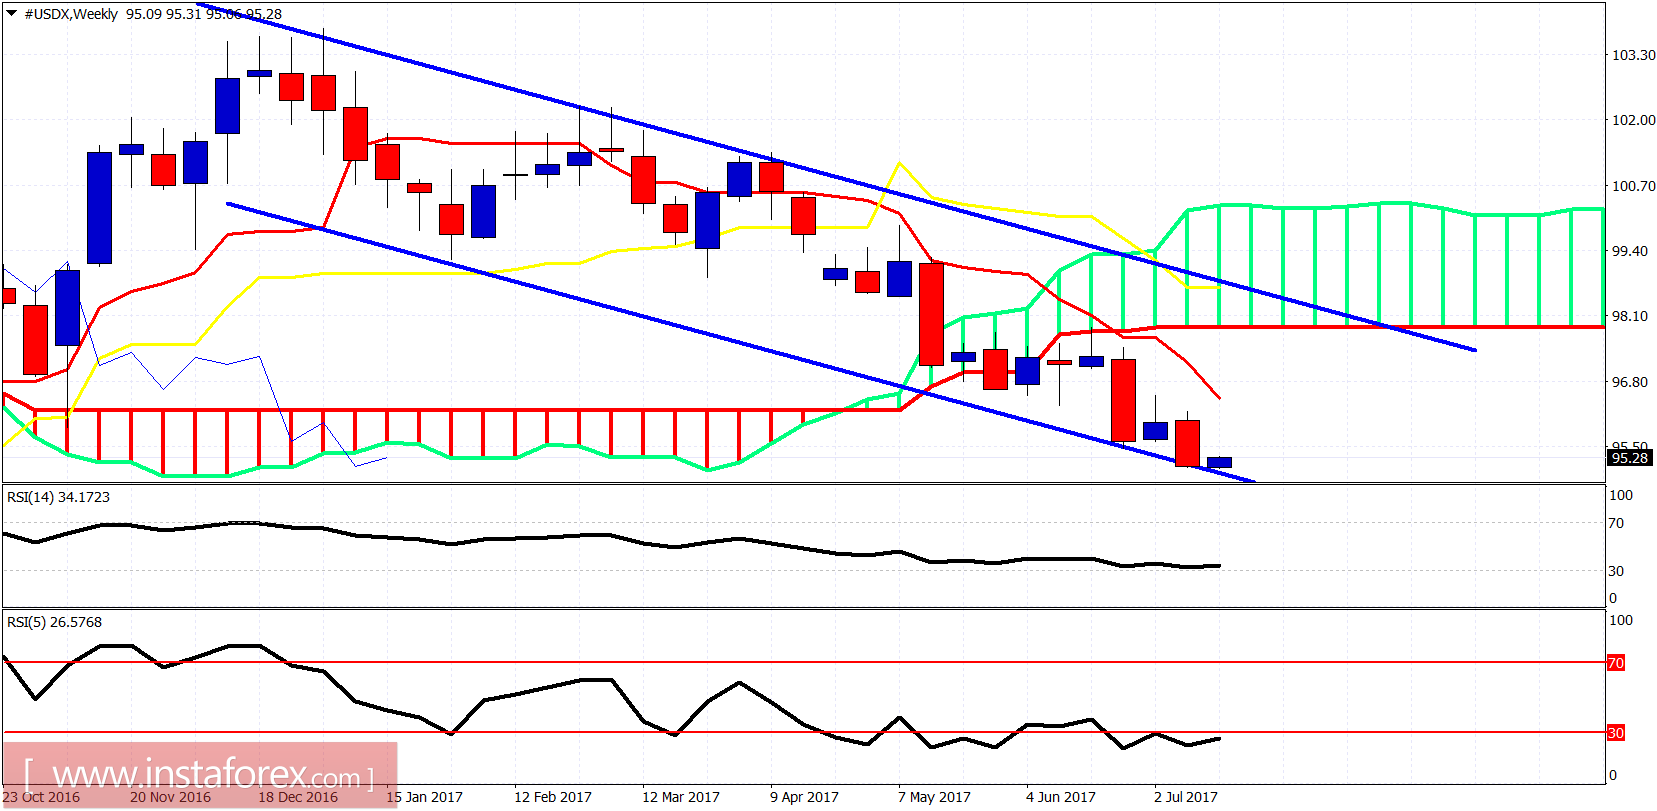
On a weekly basis the RSI continues to diverge and provide warning signs. Price makes lower lows but is trading on top of the lower channel boundary. I continue to expect a bounce towards the weekly Kumo (cloud) and upper channel boundary before committing to a short position.


