Main Quotes Calendar Forum
flag

FX.co ★ Ichimoku indicator analysis of gold for August 23, 2017

parent
Forex Analysis:::2017-08-23T07:06:08

Ichimoku indicator analysis of gold for August 23, 2017

Gold price has pulled back again towards $1,282 support yesterday but it did not break it. Price remains trapped inside a short-term trading range of $1,295-$1,282. We could push lower towards $1,275 but overall trend remains bullish and any pullback is seen as buying opportunity.

Ichimoku indicator analysis of gold for August 23, 2017

Gold price is trading above the Kumo cloud. This is a bullish sign. However, the tenkan-sen has crossed the kijun-sen to the downside. This is mainly because of the sideways movement that gold has been making since early August. I expect the cloud support to hold and to be tested, and then a new move higher above $1,300 is possible.

Ichimoku indicator analysis of gold for August 23, 2017

Black line - long-term resistance

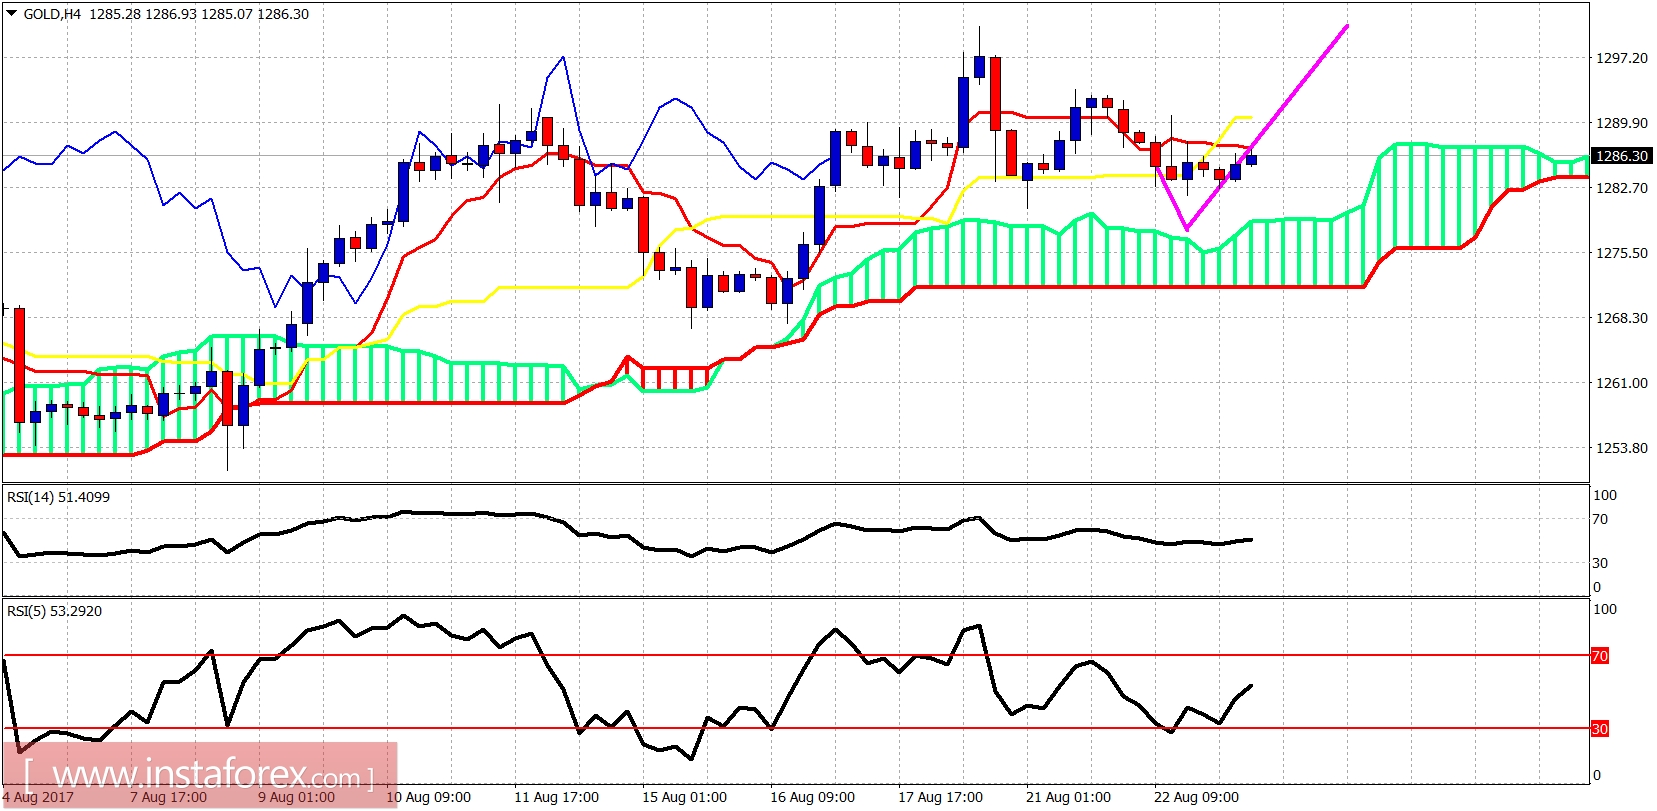
Blue line - long-term support

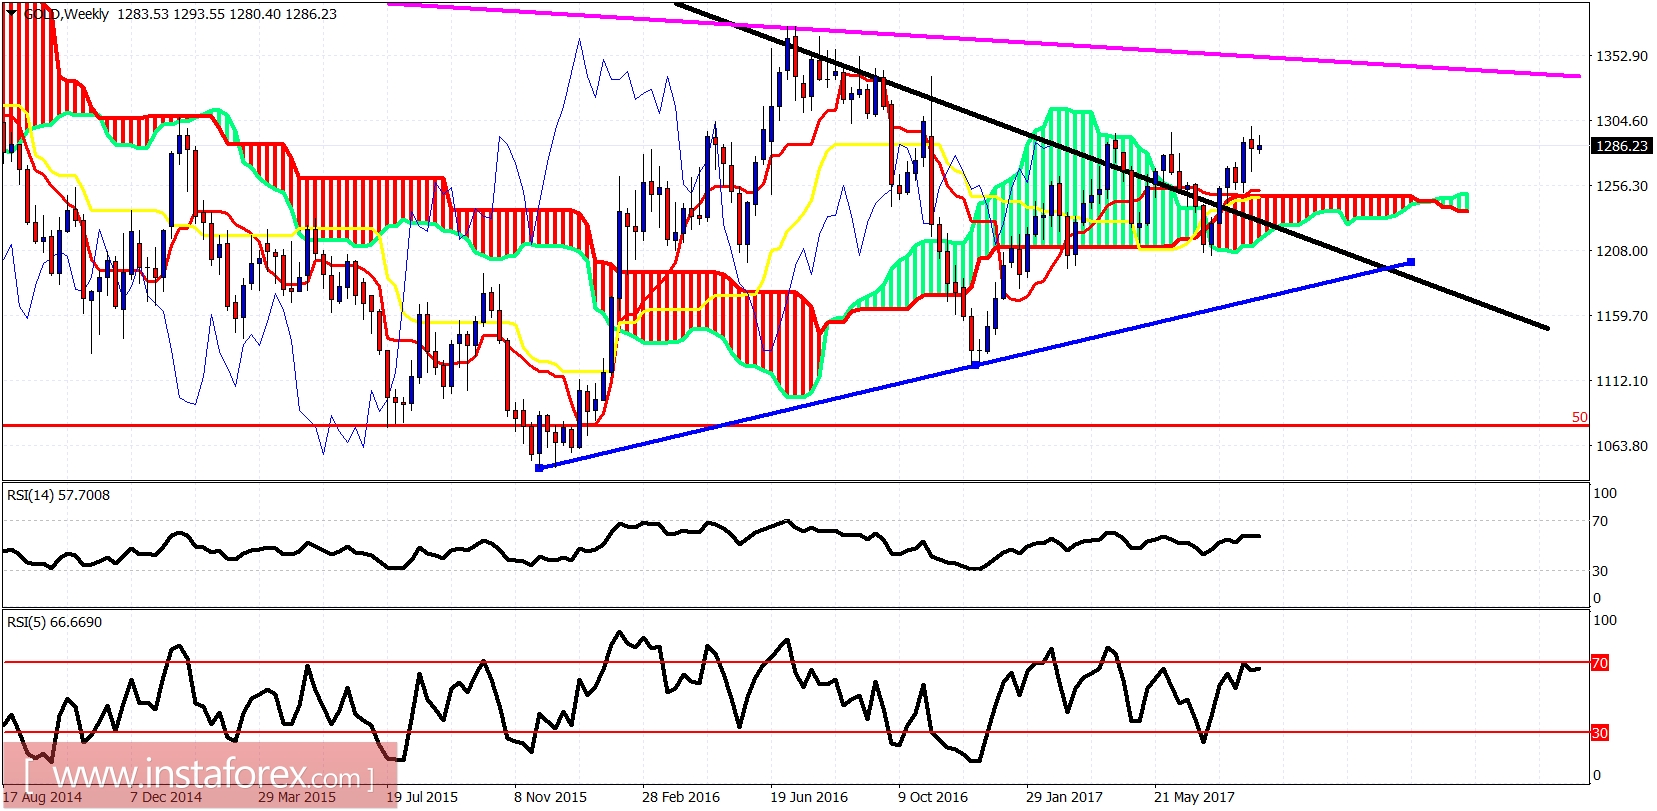
Nothing new on the weekly chart. We have a weekly breakout. The price back tested the cloud support and is making higher highs. The trend is bullish and I expect gold to move towards $1,320-$1,350 over the coming weeks.

Analyst InstaForex
Share this article:
parent
loader...
all-was_read__icon
You have watched all the best publications
presently.
We are already looking for something interesting for you...
all-was_read__star
Recently published:
loader...
More recent publications...