Main Quotes Calendar Forum
flag

FX.co ★ Ichimoku indicator analysis of USDX for August 23, 2017

parent
Forex Analysis:::2017-08-23T07:16:14

Ichimoku indicator analysis of USDX for August 23, 2017

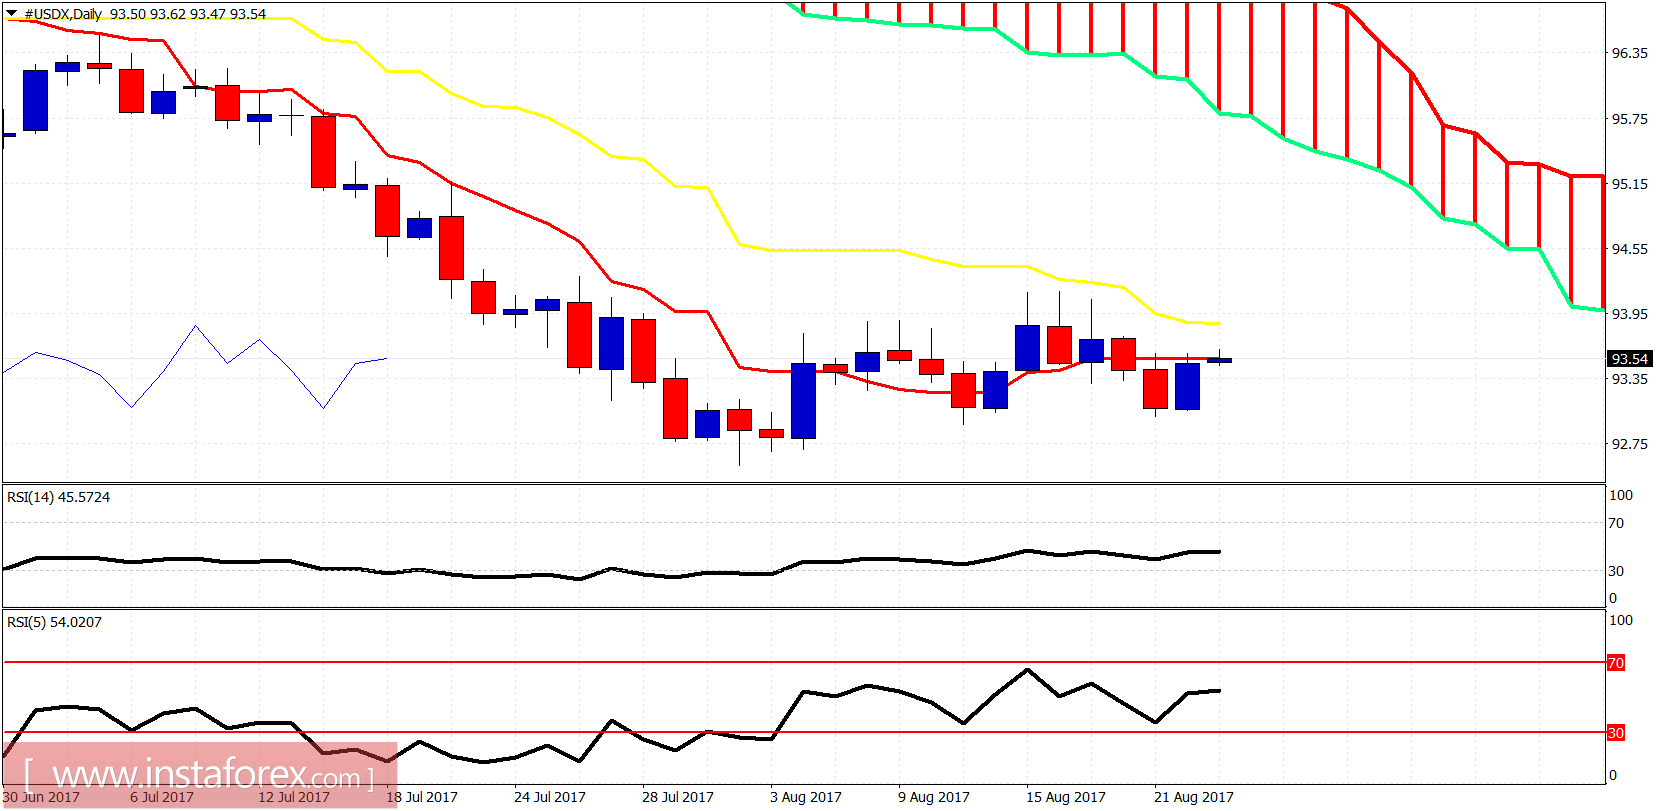
The US dollar index broke below the cloud and the channel yesterday but right away we saw a bounce that is back testing the broken support and is trying to mark the breakdown as a false one.

Ichimoku indicator analysis of USDX for August 23, 2017

Red lines - bullish channel (broken)

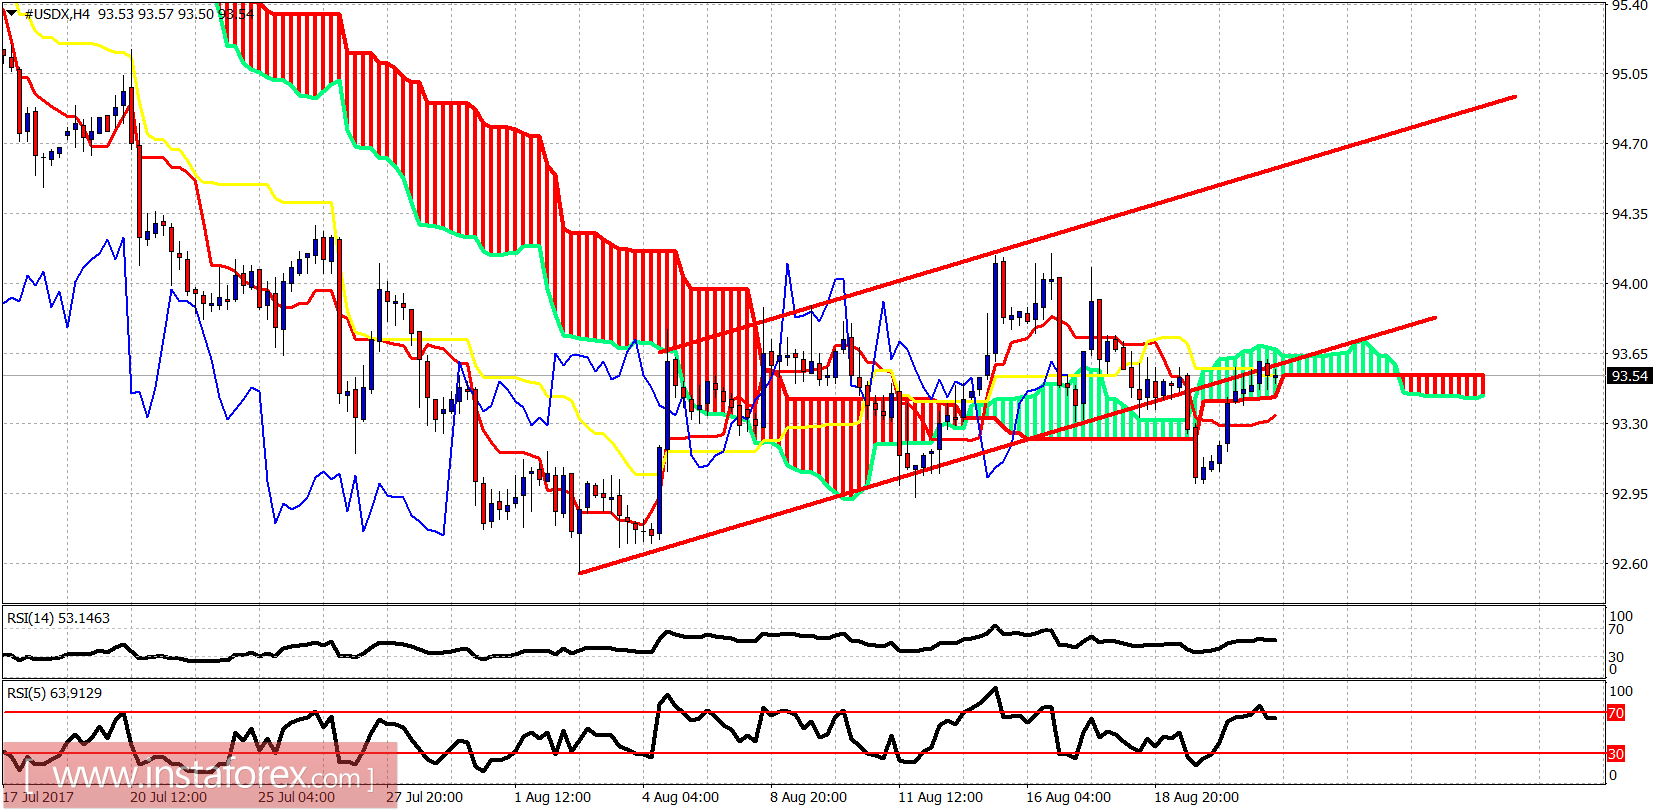
The dollar index is trying to move back above the 4 hour Kumo and inside the bullish channel. This bounce is corrective and we should expect a rejection soon to turn the price lower. The support is found at 93.30 and resistance lies at 93.70.

Ichimoku indicator analysis of USDX for August 23, 2017

On a daily basis the dollar index is trying to break above the tenkan-sen. We are in the daily resistance area. I expect a rejection here. The dollar index is likely to break towards 91 over the coming weeks.
Analyst InstaForex
Share this article:
parent
loader...
all-was_read__icon
You have watched all the best publications
presently.
We are already looking for something interesting for you...
all-was_read__star
Recently published:
loader...
More recent publications...