Main Quotes Calendar Forum
flag

FX.co ★ Ichimoku indicator analysis of USDX for September 6, 2017

parent
Forex Analysis:::2017-09-06T07:13:14

Ichimoku indicator analysis of USDX for September 6, 2017

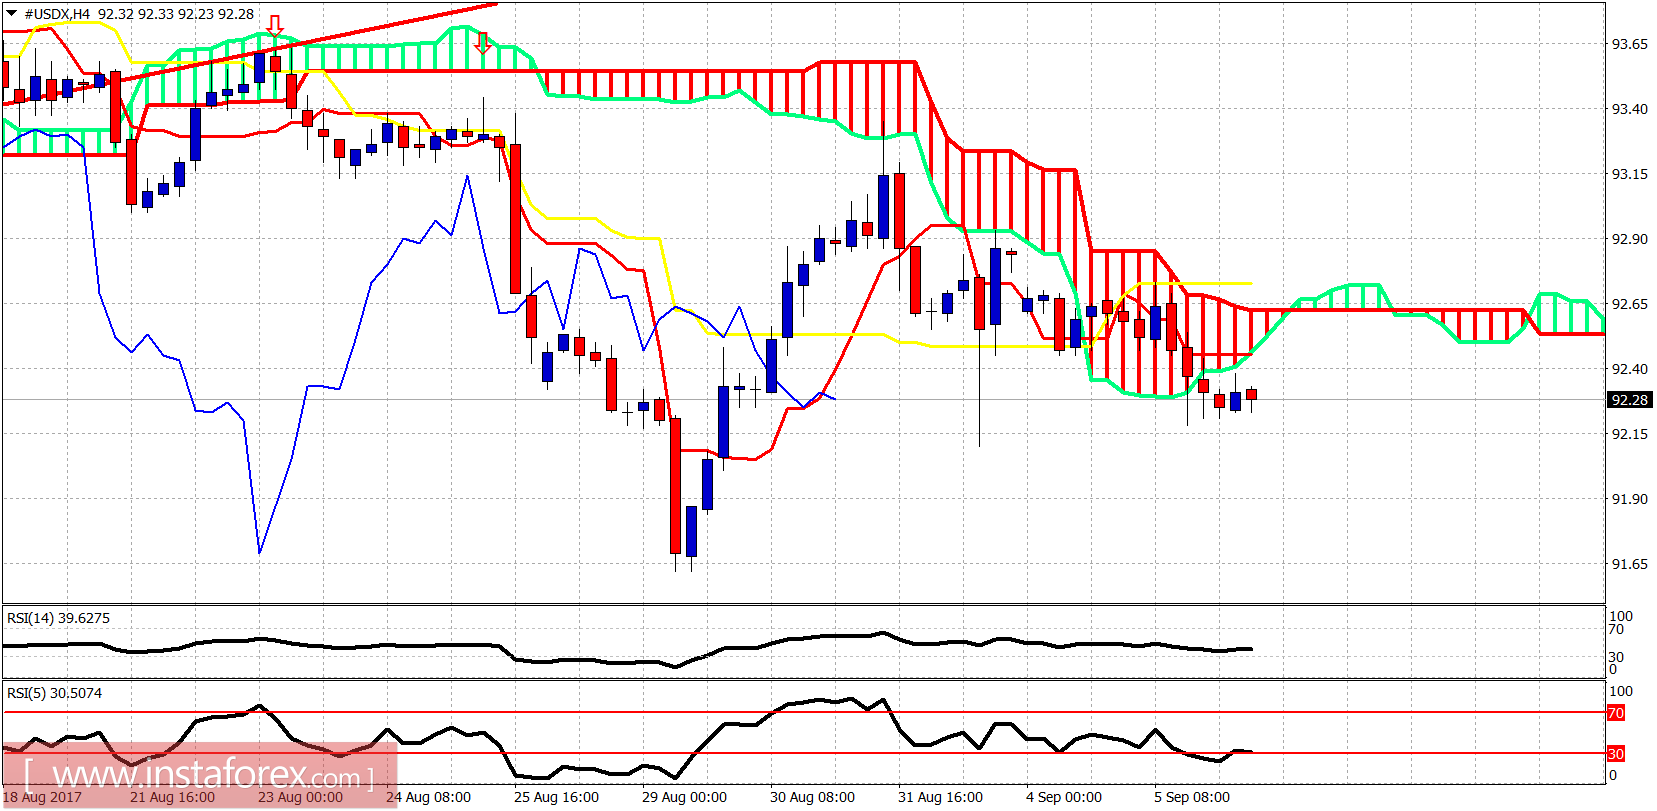
The Dollar index tried to break out of the 4-hour Kumo resistance yesterday and change short-term trend to bullish, but it got rejected and has now broken below Ichimoku cloud support once again.

Ichimoku indicator analysis of USDX for September 6, 2017

Price is trading below the 4-hour Kumo and both the tenkan- and kijun-sen indicators. Trend is bearish. Resistance is at 92.70 and support at 91.60. Intermediate support can be found at 92.10. As long as price is below 92.70 trend will remain bearish and price will head towards 90.

Ichimoku indicator analysis of USDX for September 6, 2017

Red lines - bearish channel

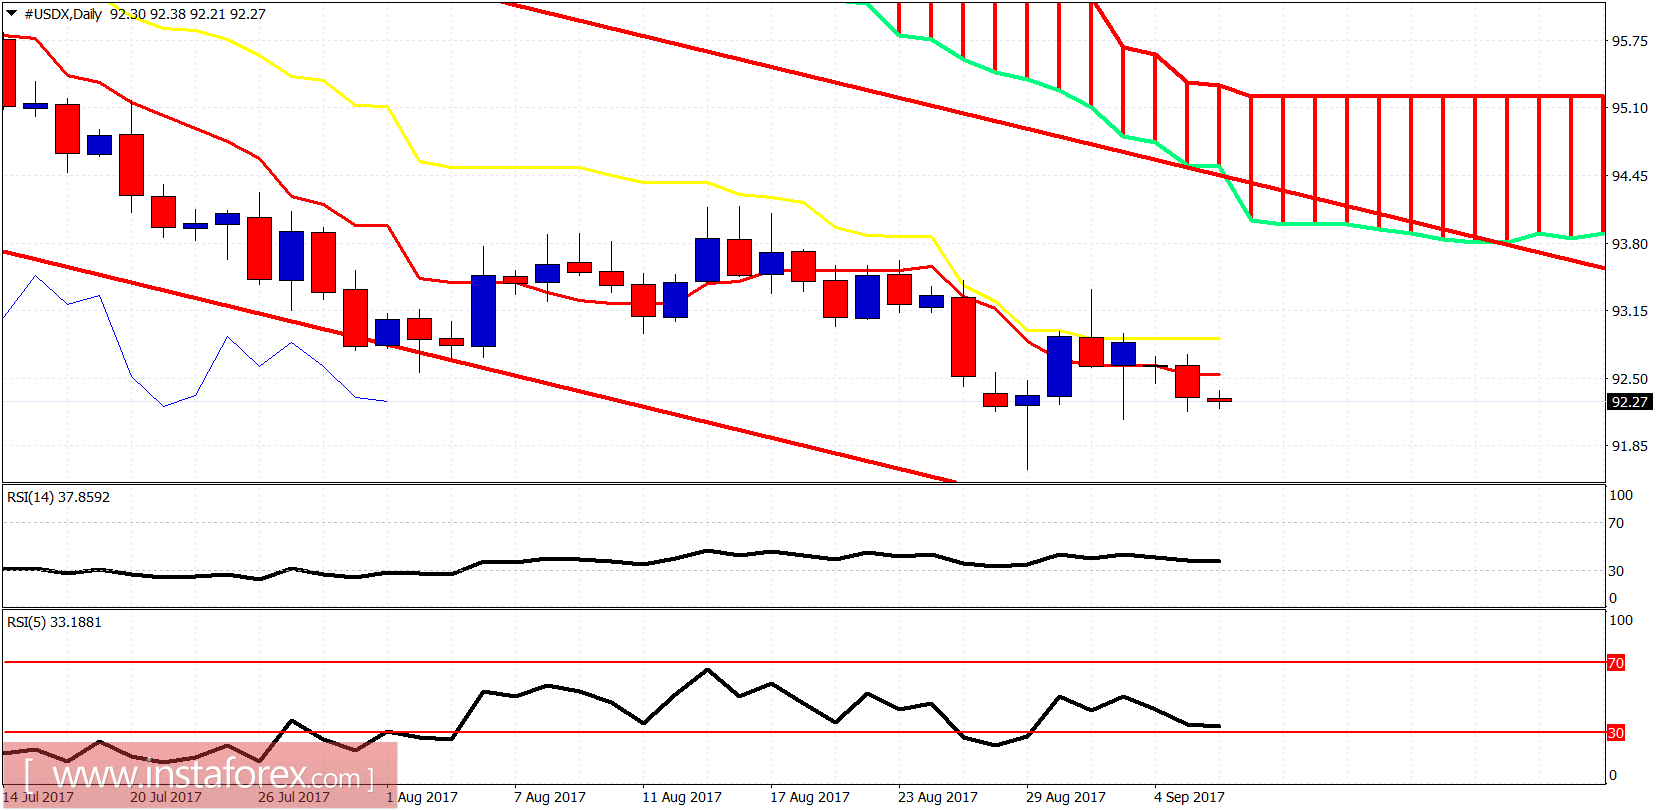
On a daily basis, trend is bearish. Price broke below the tenkan-sen yesterday. This is not a good sign for Dollar bulls. Daily resistance is between 92.55-92.90. As long as price is below this area on a daily basis, we will be waiting for new lows. Break this resistance and we move towards 94.

Analyst InstaForex
Share this article:
parent
loader...
all-was_read__icon
You have watched all the best publications
presently.
We are already looking for something interesting for you...
all-was_read__star
Recently published:
loader...
More recent publications...