Main Quotes Calendar Forum
flag

FX.co ★ Ichimoku indicator analysis of gold for September 26, 2017

parent
Forex Analysis:::2017-09-26T07:12:39

Ichimoku indicator analysis of gold for September 26, 2017

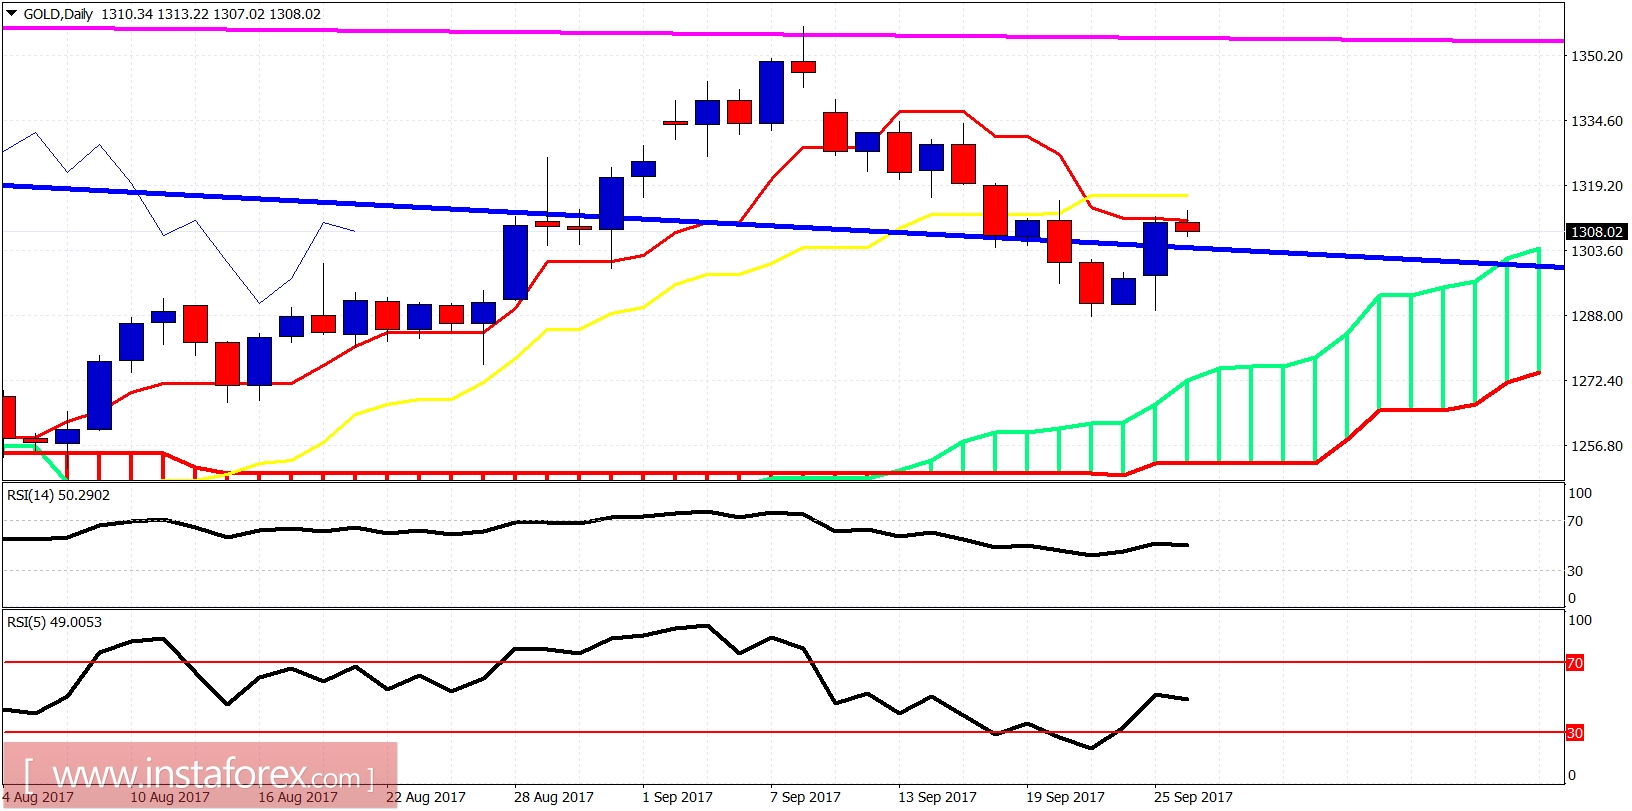
Gold price has broken out of the bearish channel yesterday as we expected. Price has stopped right below the 4-hour Kumo and shows signs of rejection. However I believe the next leg up towards $1,400 has started.

Ichimoku indicator analysis of gold for September 26, 2017

Red lines - bearish channel

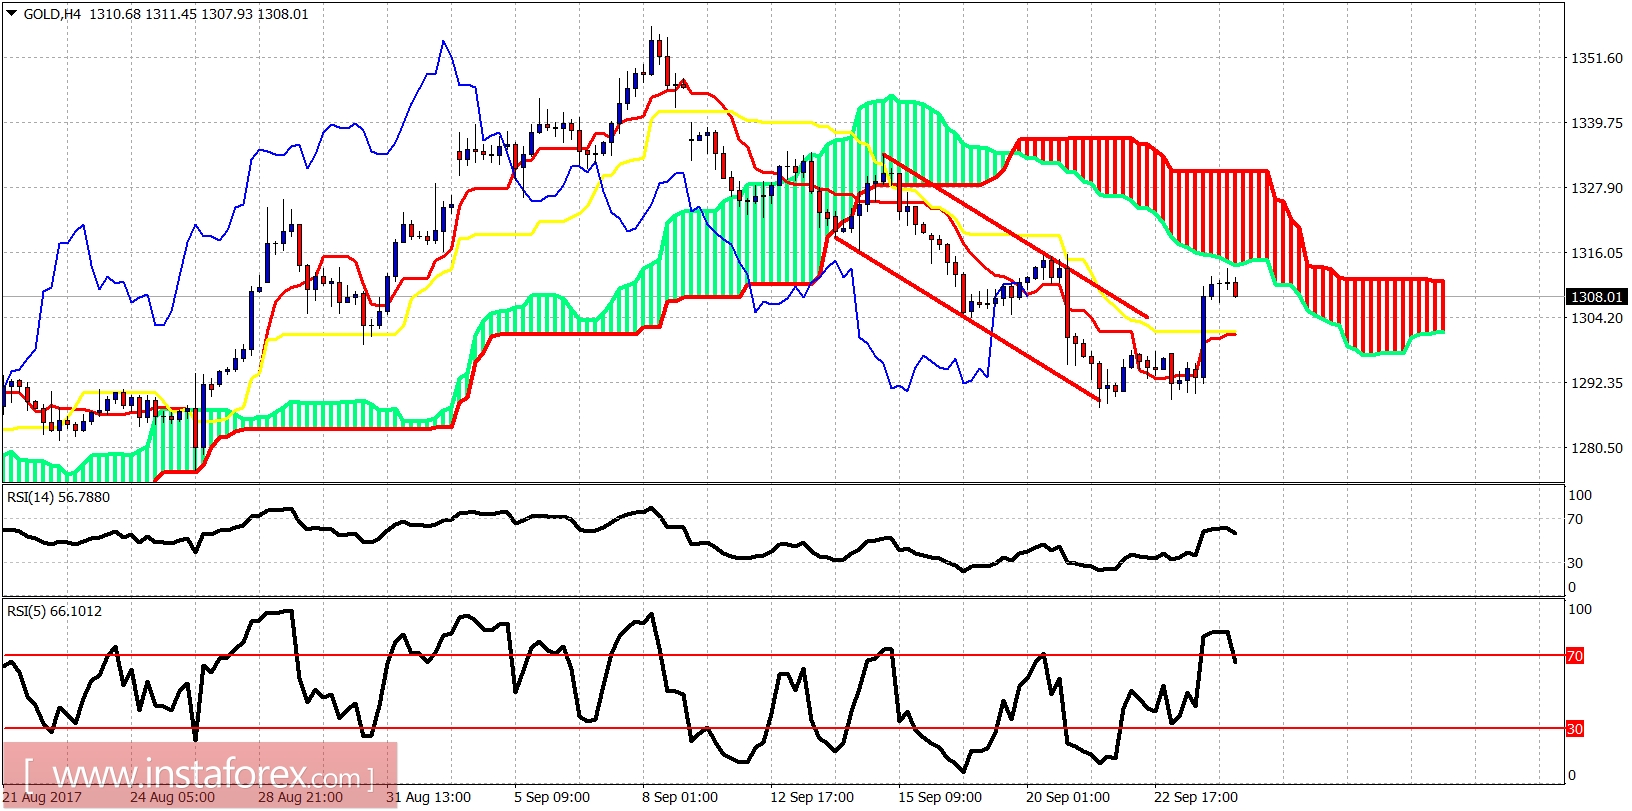
Gold price has reached the 4-hour Kumo (cloud) after breaking the bearish channel. Price has stopped right at the resistance and is pulling back. Short-term support is at $1,301. Resistance is at $1,316.

Ichimoku indicator analysis of gold for September 26, 2017

On a daily basis Gold price has bounced as expected and stopped right at the daily tenkan-sen (red line indicator) resistance. Price needs to move above $1,316-20 level in order for bulls to feel more confident. I believe Gold has made an important low at $1,288. Breaking below that level will open the way for a move towards $1,270-60.
Analyst InstaForex
Share this article:
parent
loader...
all-was_read__icon
You have watched all the best publications
presently.
We are already looking for something interesting for you...
all-was_read__star
Recently published:
loader...
More recent publications...