


The US Dollar is extending its gains as the index broke above short-term resistance at 92.70 and price has reached our short-term target of 93-93.50. The Dollar index is testing now important daily cloud resistance.
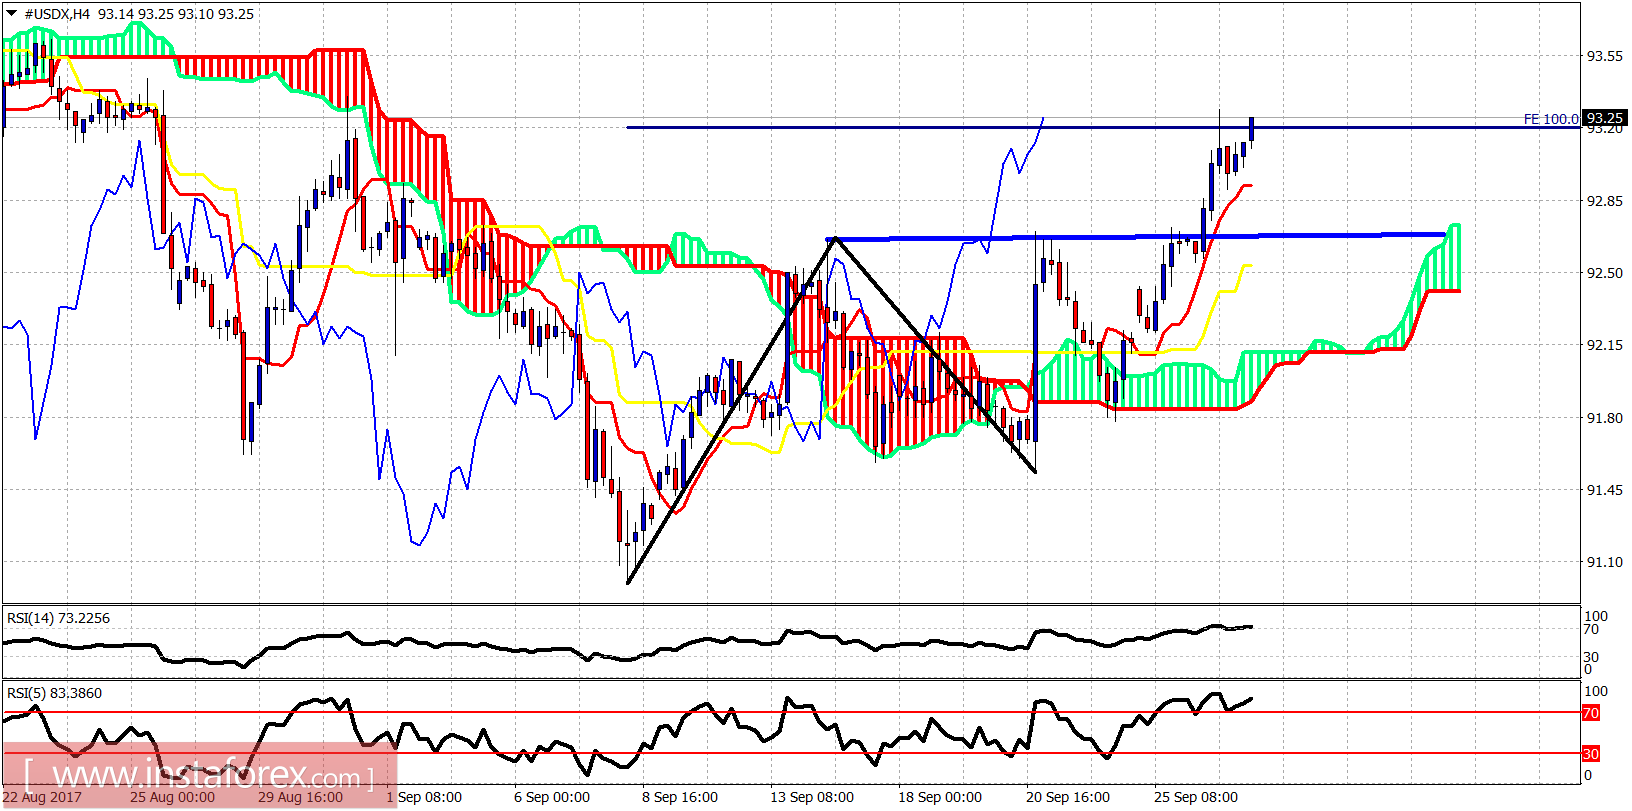
Blue line - resistance
The Dollar index has reached our 100% target extension of the first leg up. Price is trading above both the tenkan- and kijun-sen indicators (red and yellow lines). Trend is bullish in the 4-hour chart. Support is at 92.95 and at 92.65.
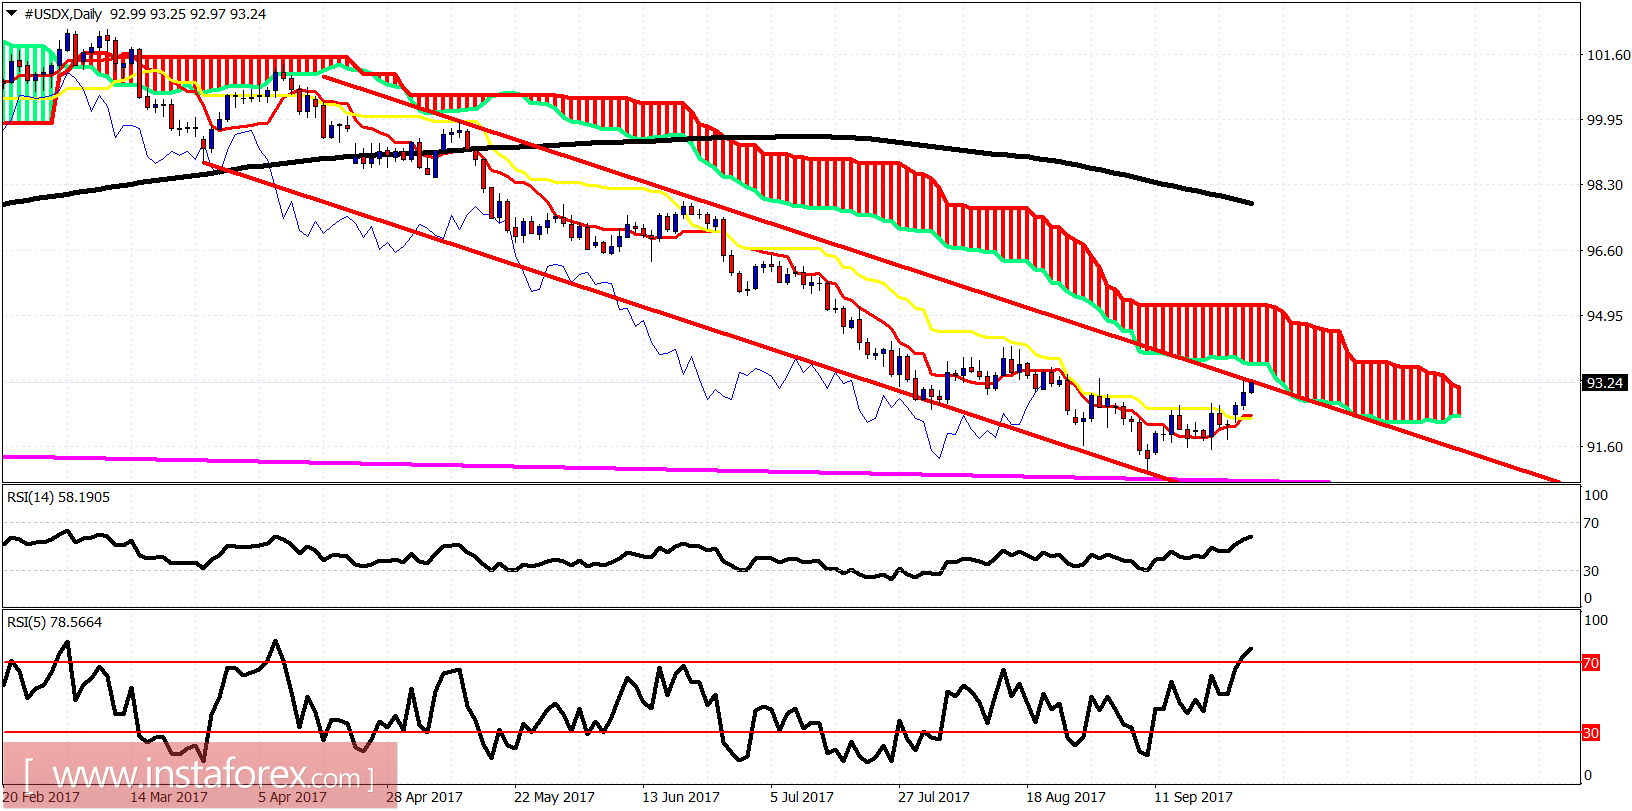
Red lines - bearish channel
The Dollar index has reached the upper boundary of the bearish channel and is very close to the Daily Kumo (cloud) resistance. This resistance is at 93.70. Daily support is found at 92.40. A move below 92.40 will confirm that the bounce is complete. I believe it is more probable to see a reversal to the downside than a continuation of this upward bounce.


