Main Quotes Calendar Forum
flag

FX.co ★ Ichimoku indicator analysis of gold for September 27, 2017

parent
Forex Analysis:::2017-09-27T07:03:23

Ichimoku indicator analysis of gold for September 27, 2017

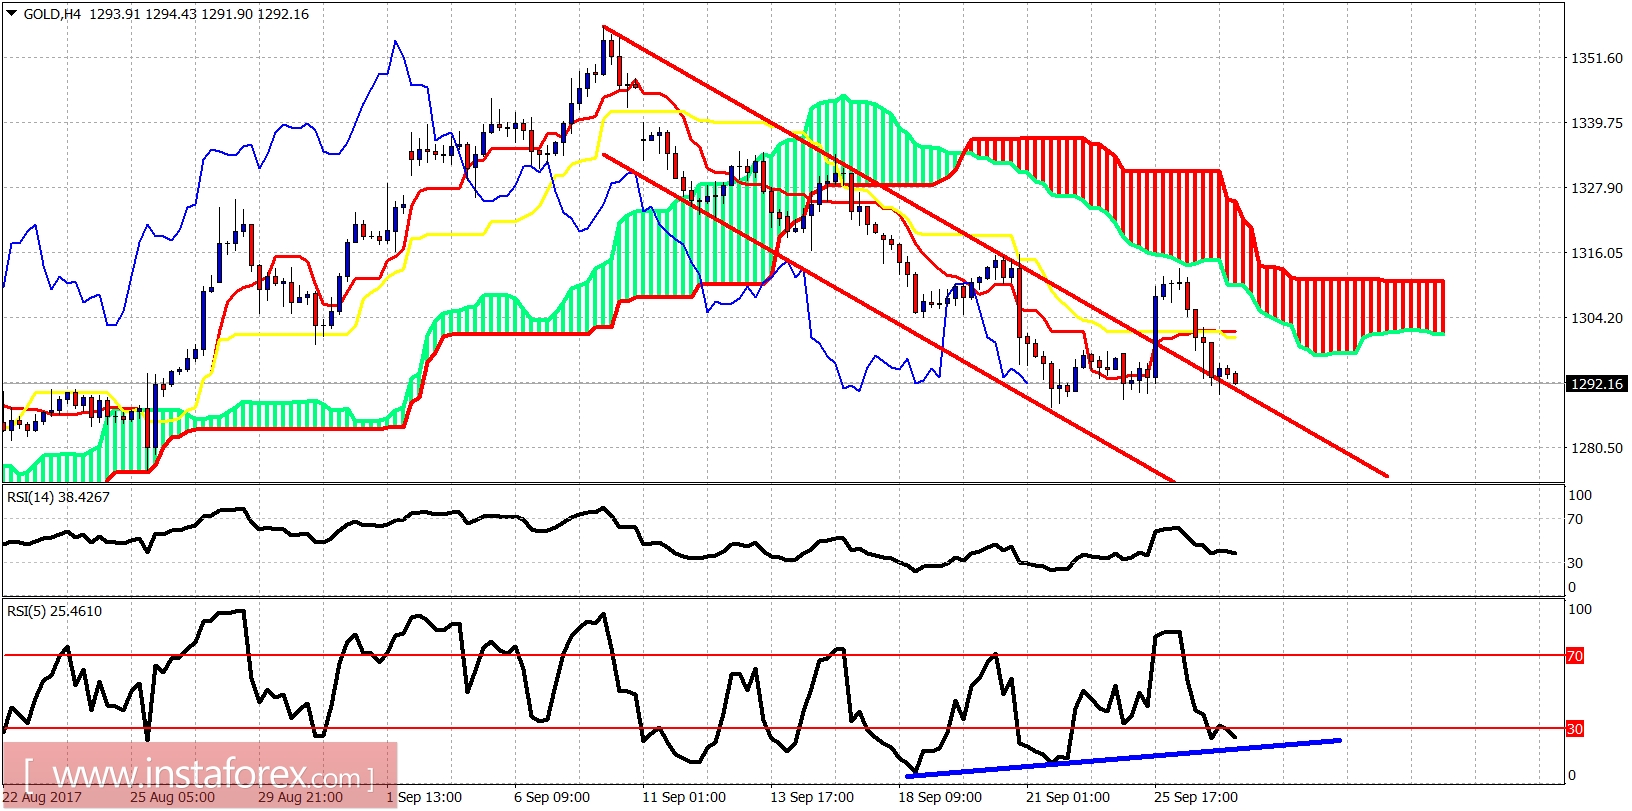
After the rejection in the 4-hour cloud resistance at $1,313, Gold price is now back at its monthly lows. Downside is limited. Price will find support at $1,277. A new low will provide another divergence in the RSI. This is bullish.
Ichimoku indicator analysis of gold for September 27, 2017

Red lines - bearish channel

Blue line - bullish divergence

Gold price got rejected by the Kumo yesterday and is back testing the broken bearish channel. Price could make a new low as trend in Ichimoku terms in the 4-hour chart remains bearish. However, a new low is expected not to make a new low in the RSI. This will be a bullish signal, implying that downside is limited.
Ichimoku indicator analysis of gold for September 27, 2017

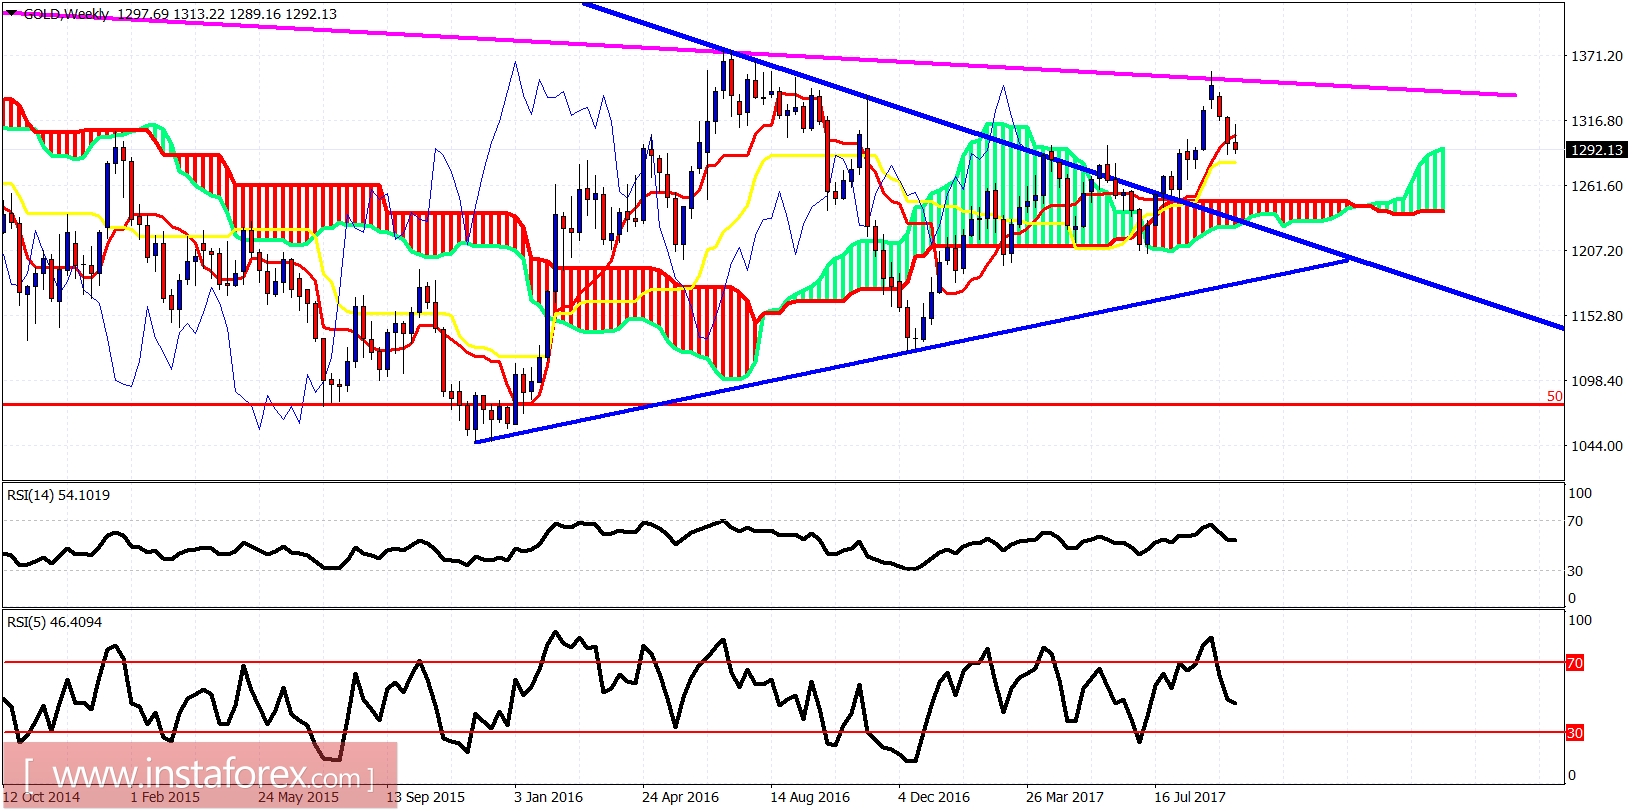
On a weekly basis, Gold price is above the kijun-sen (yellow line indicator). Support is at $1,280. I believe Gold will hold that level. If this level is broken, the weekly downside potential will be at $1,245. Longer-term view and trend for Gold remains bullish. This pullback is considered a buying opportunity.
Analyst InstaForex
Share this article:
parent
loader...
all-was_read__icon
You have watched all the best publications
presently.
We are already looking for something interesting for you...
all-was_read__star
Recently published:
loader...
More recent publications...