


EUR/USD
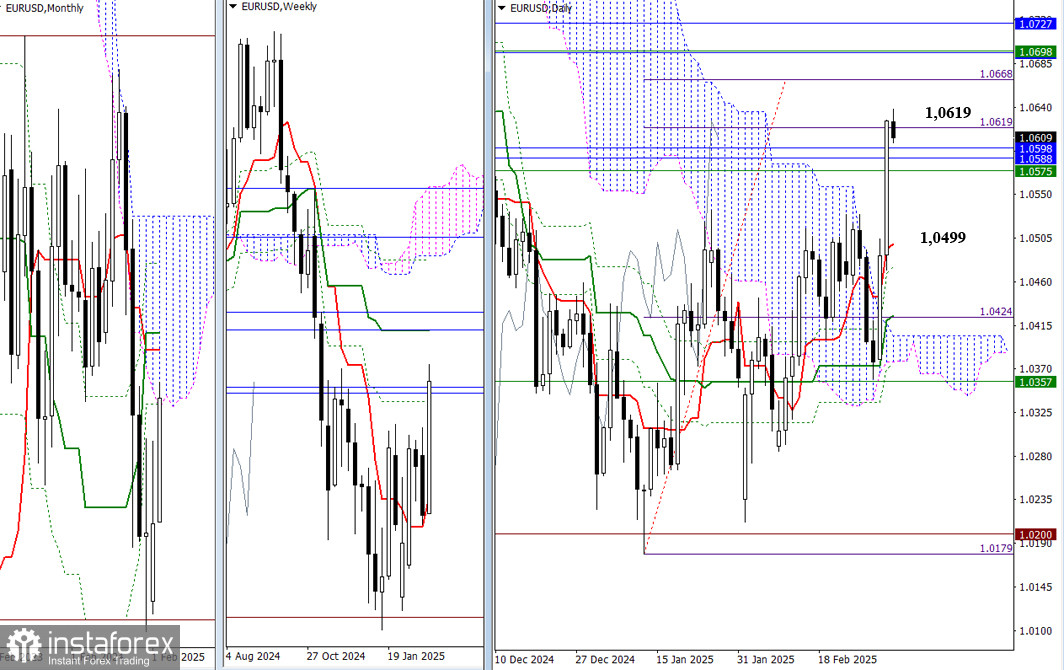
नई सप्ताह की शुरुआत बुलिश ट्रेडर्स को आशावादी और प्रभावी बने रहने का कारण देती है। उन्होंने न केवल दैनिक इचिमोकू क्लाउड से बाहर निकलकर एक ब्रेकआउट लक्ष्य बनाया है, बल्कि शुरुआती लक्ष्य स्तर 1.0619 तक भी तेजी से पहुंच गए हैं। इस संदर्भ में, अगले बुलिश लक्ष्य 1.0668, 1.0698 और 1.0727 पर पहचाने जा सकते हैं। इन स्तरों को प्राप्त करना न केवल दैनिक ब्रेकआउट लक्ष्य को पूरी तरह साकार करेगा बल्कि मासिक इचिमोकू क्रॉस और मध्यम अवधि की साप्ताहिक प्रवृत्ति के प्रमुख प्रतिरोधों का भी परीक्षण करेगा।
कल, 1.0619 के लक्ष्य स्तर तक पहुंचने के रास्ते में, इस जोड़ी ने 1.0575, 1.0588 और 1.0598 के कई मजबूत प्रतिरोध स्तरों को पार कर लिया, जिससे यह मासिक क्लाउड में प्रवेश कर गई। आज, ये टूटे हुए स्तर निचले टाइमफ्रेम पर समर्थन के रूप में कार्य कर सकते हैं, जिससे बुल्स को अपने लाभ बनाए रखने में मदद मिल सकती है।
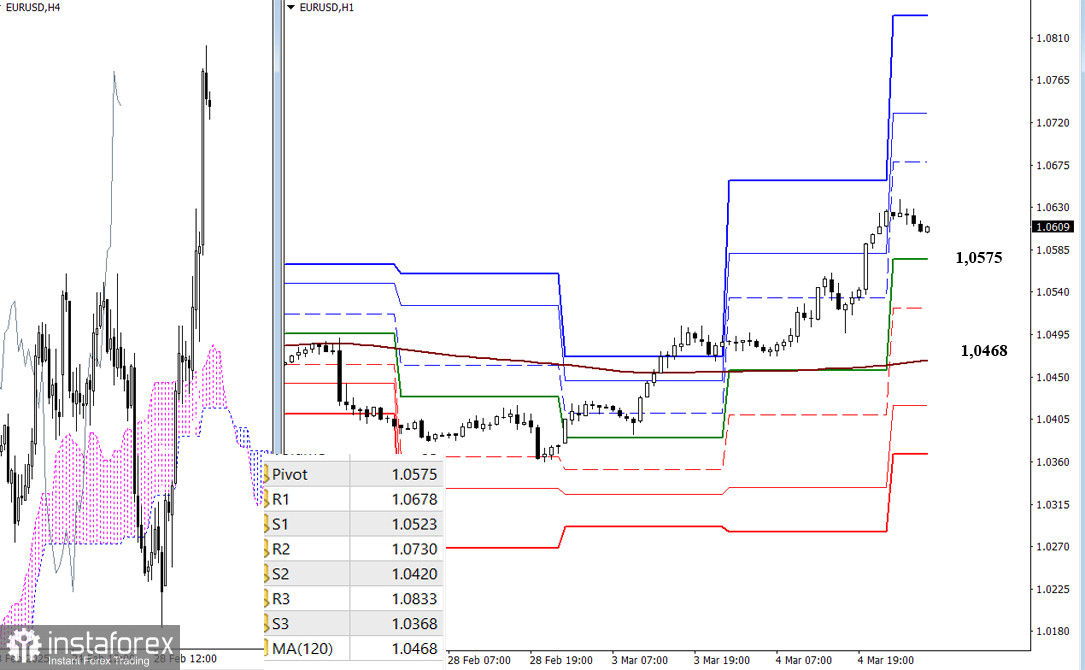
On the lower timeframes, the bulls currently hold the main advantage, as we observe an uptrend formation. Intraday bullish targets today are set at 1.0678, 1.0730, and 1.0833 (the resistances of the classic Pivot levels). A downward correction could jeopardize the testing of key levels at 1.0575 (the central daily Pivot level) and 1.0468 (the weekly long-term trend), with an intermediate support at S1 positioned at 1.0523. A breakout and subsequent trend reversal could significantly shift the balance of power. Further strengthening of bearish sentiment would likely unfold through the classic Pivot level supports at 1.0420 and 1.0368.
***
GBP/USD
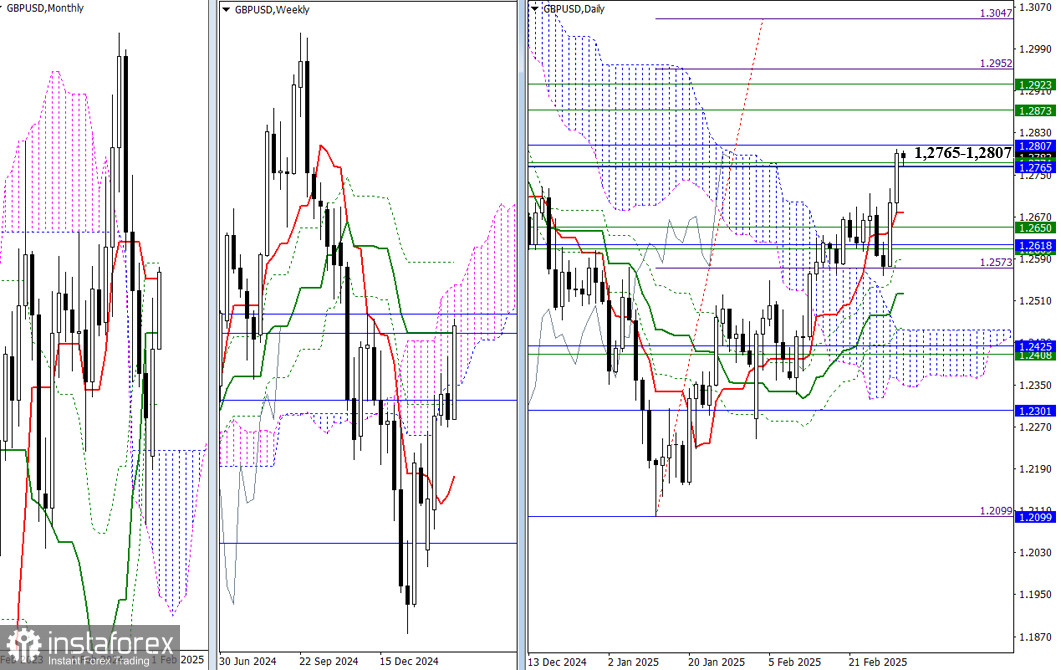
In the first two days of the new week, the bulls have achieved what they were unable to accomplish in the previous two weeks. The pair is currently testing the resistance levels of the monthly Ichimoku cross at 1.2765–1.2807 and the medium-term weekly trend at 1.2766. If these levels are broken, the next targets will include a breakout from the weekly cloud at 1.2873, the elimination of the weekly Ichimoku cross at 1.2923, and reaching the daily breakout target of 1.2952–1.3047. However, if the bulls fail and the upward movement is halted, the pair could return to previously crossed levels around 1.2650–1.2618, with the first support encountered at the daily short-term trend of 1.2678.
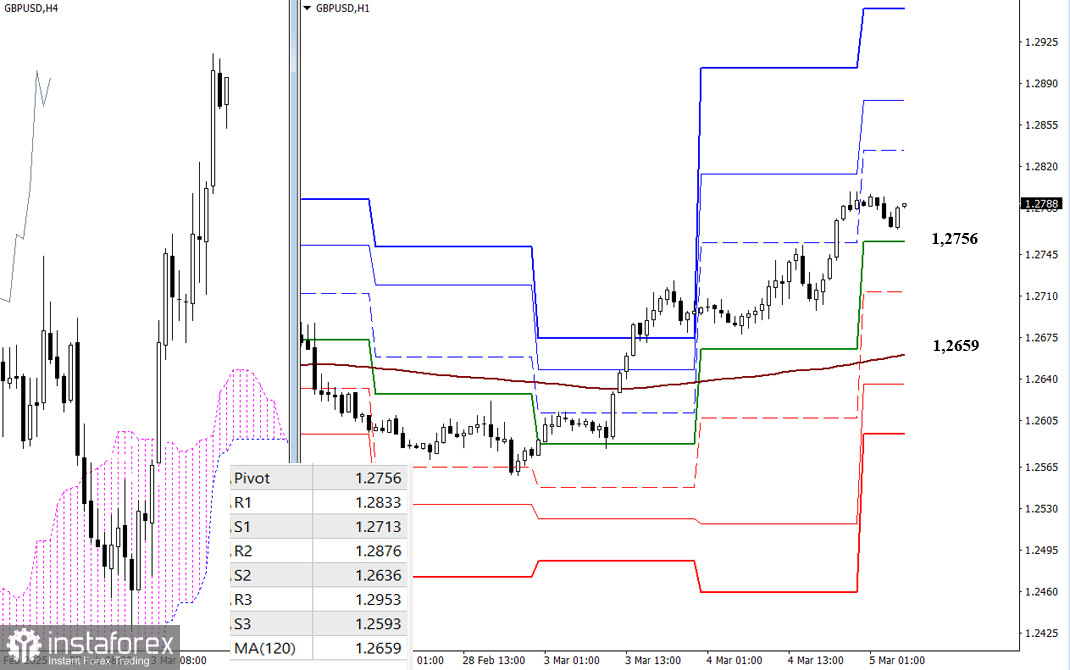
Currently, the bulls hold a significant advantage on the lower timeframes. To continue the uptrend, intraday targets are set at the classic Pivot level resistances of 1.2833, 1.2876, and 1.2953. If the bears manage to take control, their key support levels will be at 1.2756 (the central daily Pivot level) and 1.2659 (the weekly long-term trend). A breakout and trend reversal could shift the balance of power in favor of the bears, leading to a further strengthening of bearish sentiment. Additional intraday targets for bearish traders include the classic Pivot level supports at 1.2713, 1.2636, and 1.2593.
***
Technical Analysis Components:
- Higher Timeframes: Ichimoku Kinko Hyo (9.26.52) and Fibonacci Kijun levels
- H1: Classic Pivot Points and 120-period Moving Average (weekly long-term trend)


