


Gold price has broken out and below of the short-term bullish channel and is now trading below $1,700. Price is making lower lows and lower highs and we have now a formed bearish short-term channel.
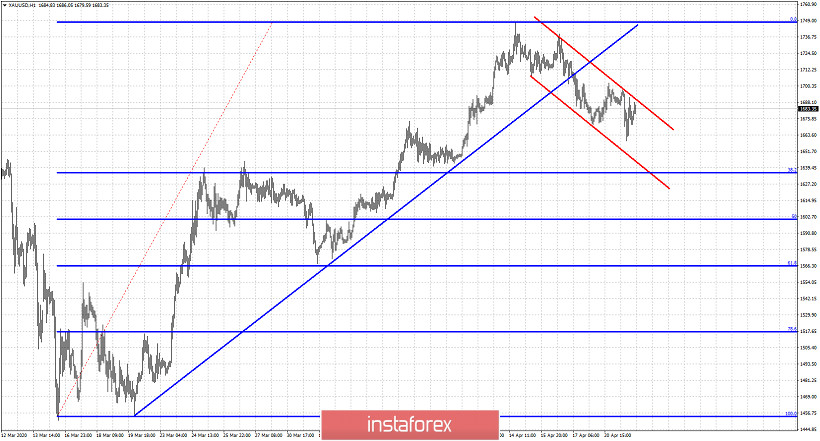
Blue line- support trend line
The support trend line has been broken. Gold is inside the red channel and is heading towards the 38% Fibonacci retracement around $1,635 where we find the first very important Fibonacci retracement level. Breaking below it will open the way for a move towards $1.565. In previous analysis we noted several times that although Gold price was still in a bullish Daily trend, there were several warning signals that a top is imminent and that price could pull back. Price is more than $50 below 2020 highs and if this downward move continues, we should expect the March lows to be tested. Breaking below the March lows will be a huge hit to bulls as this could bring more selling pressure to Gold. Until then we focus on two major support levels, $1,635 and $1,565.


